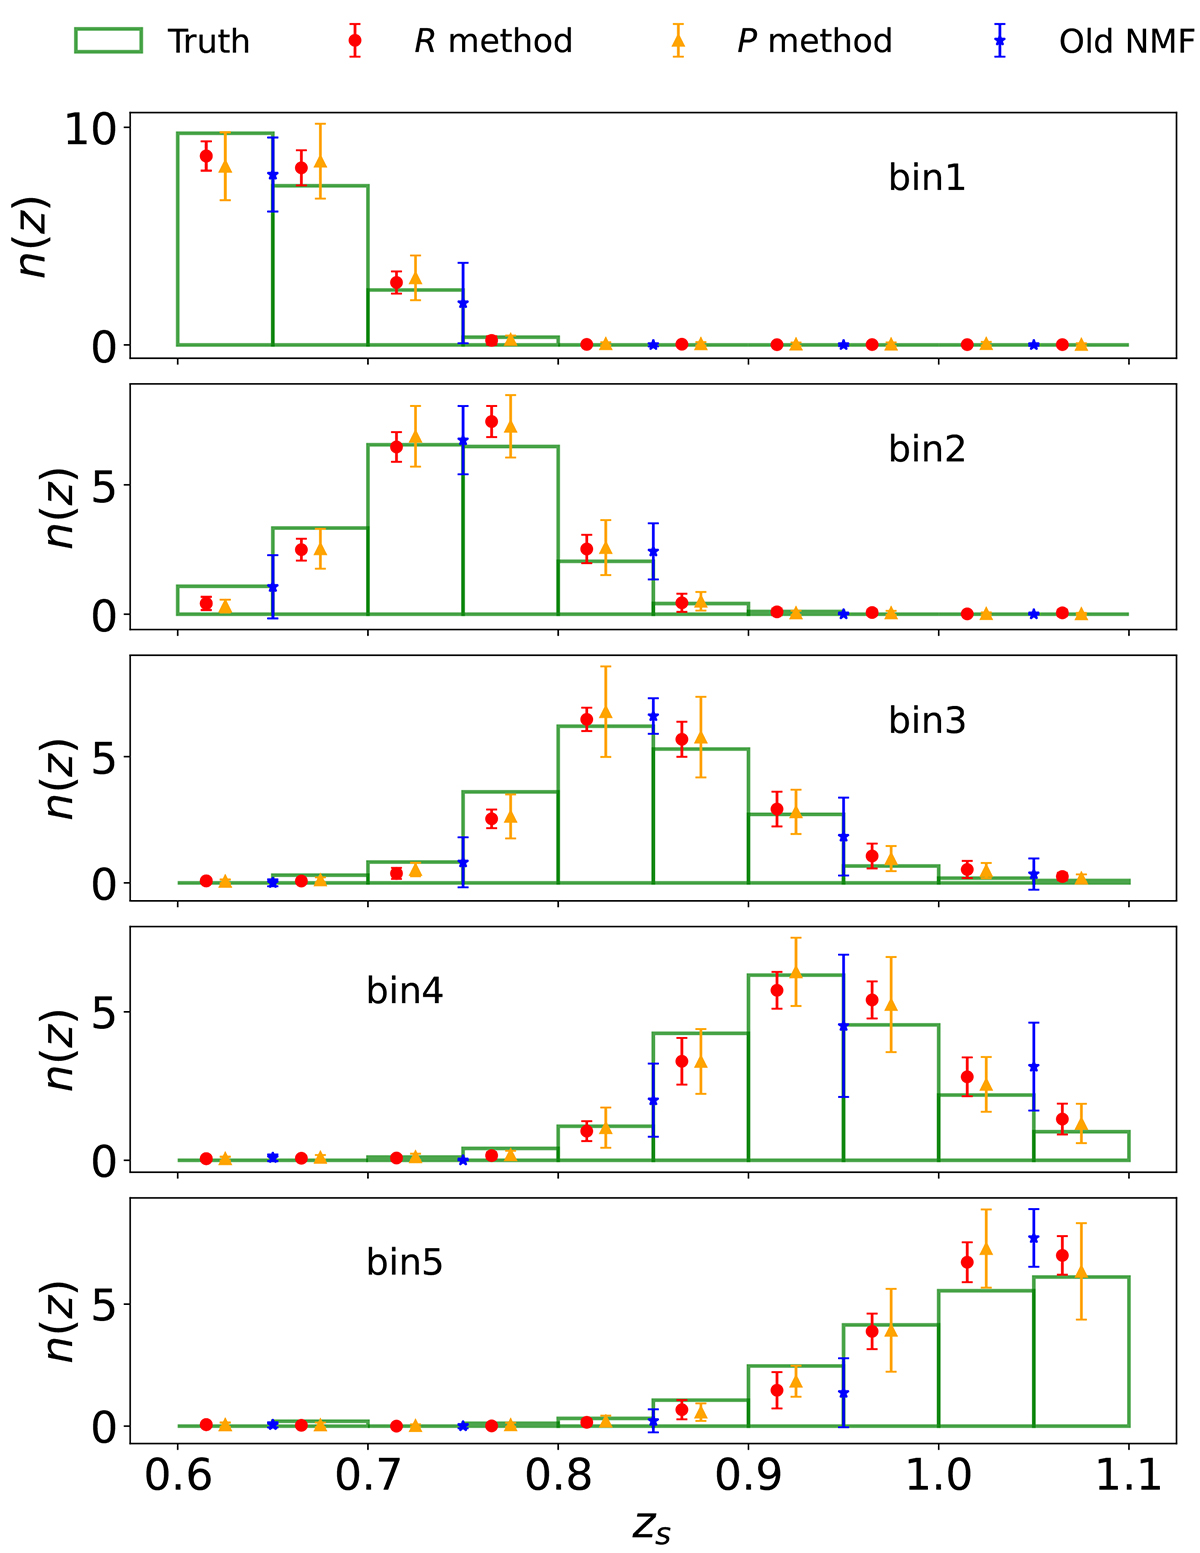
Fig. 4.
Download original image
Comparison of the true-z distribution obtained by different implementations of the SC method with the direct measurement on the mock (green bars). The results obtained using the R method (red), P method (orange), and the Old NMF (blue) are compared. Because the Old NMF is not stable when it is run with resolution Δz = 0.05, we can only produce the results with Δz = 0.1.
Current usage metrics show cumulative count of Article Views (full-text article views including HTML views, PDF and ePub downloads, according to the available data) and Abstracts Views on Vision4Press platform.
Data correspond to usage on the plateform after 2015. The current usage metrics is available 48-96 hours after online publication and is updated daily on week days.
Initial download of the metrics may take a while.