Fig. 3.
Download original image
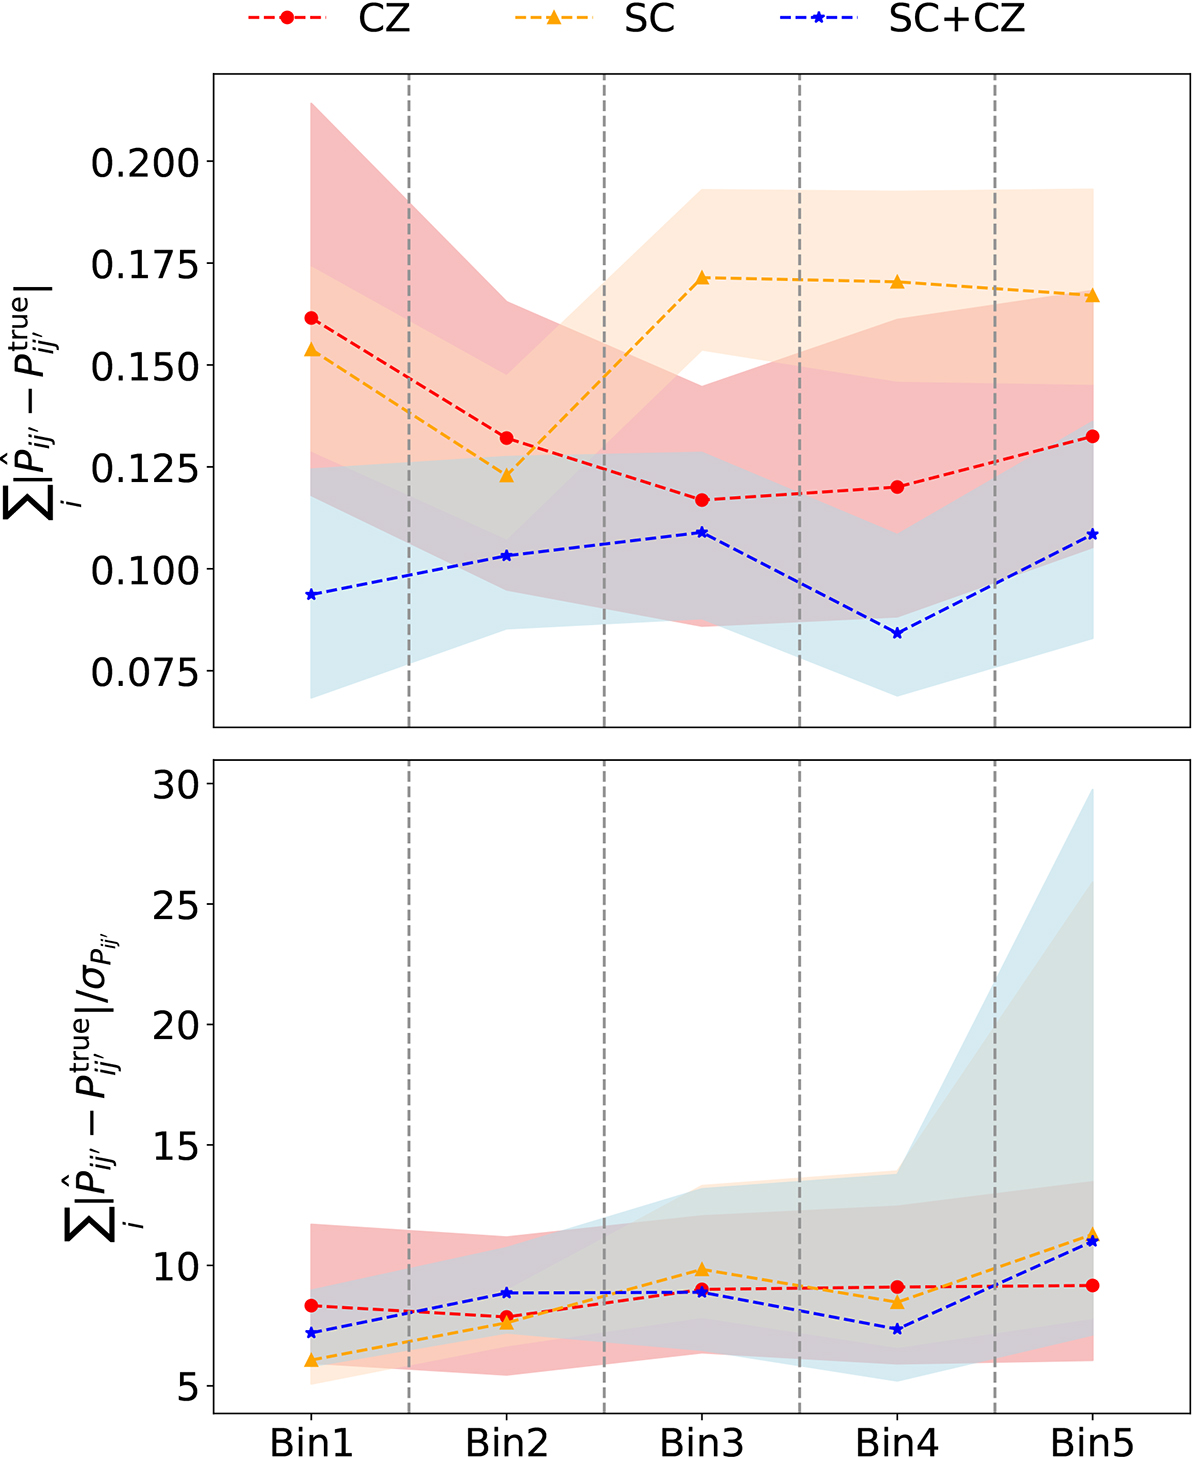
Comparison of the accuracy of the true-z distribution inferred using CZ (red), SC (orange), and SC+CZ (blue). Upper panel: ![]() , the absolute difference between the true-z distribution measured from the mock, Pij′true and the one estimated,
, the absolute difference between the true-z distribution measured from the mock, Pij′true and the one estimated, ![]() . Lower panel:
. Lower panel: ![]() the absolute difference normalized by the estimated error σPij′. The line and color band represent the median and the 16 and 84 percentile among 100 mock runs. The results for five tomographic bins are shown.
the absolute difference normalized by the estimated error σPij′. The line and color band represent the median and the 16 and 84 percentile among 100 mock runs. The results for five tomographic bins are shown.
Current usage metrics show cumulative count of Article Views (full-text article views including HTML views, PDF and ePub downloads, according to the available data) and Abstracts Views on Vision4Press platform.
Data correspond to usage on the plateform after 2015. The current usage metrics is available 48-96 hours after online publication and is updated daily on week days.
Initial download of the metrics may take a while.