Open Access
Fig. 2.
Download original image
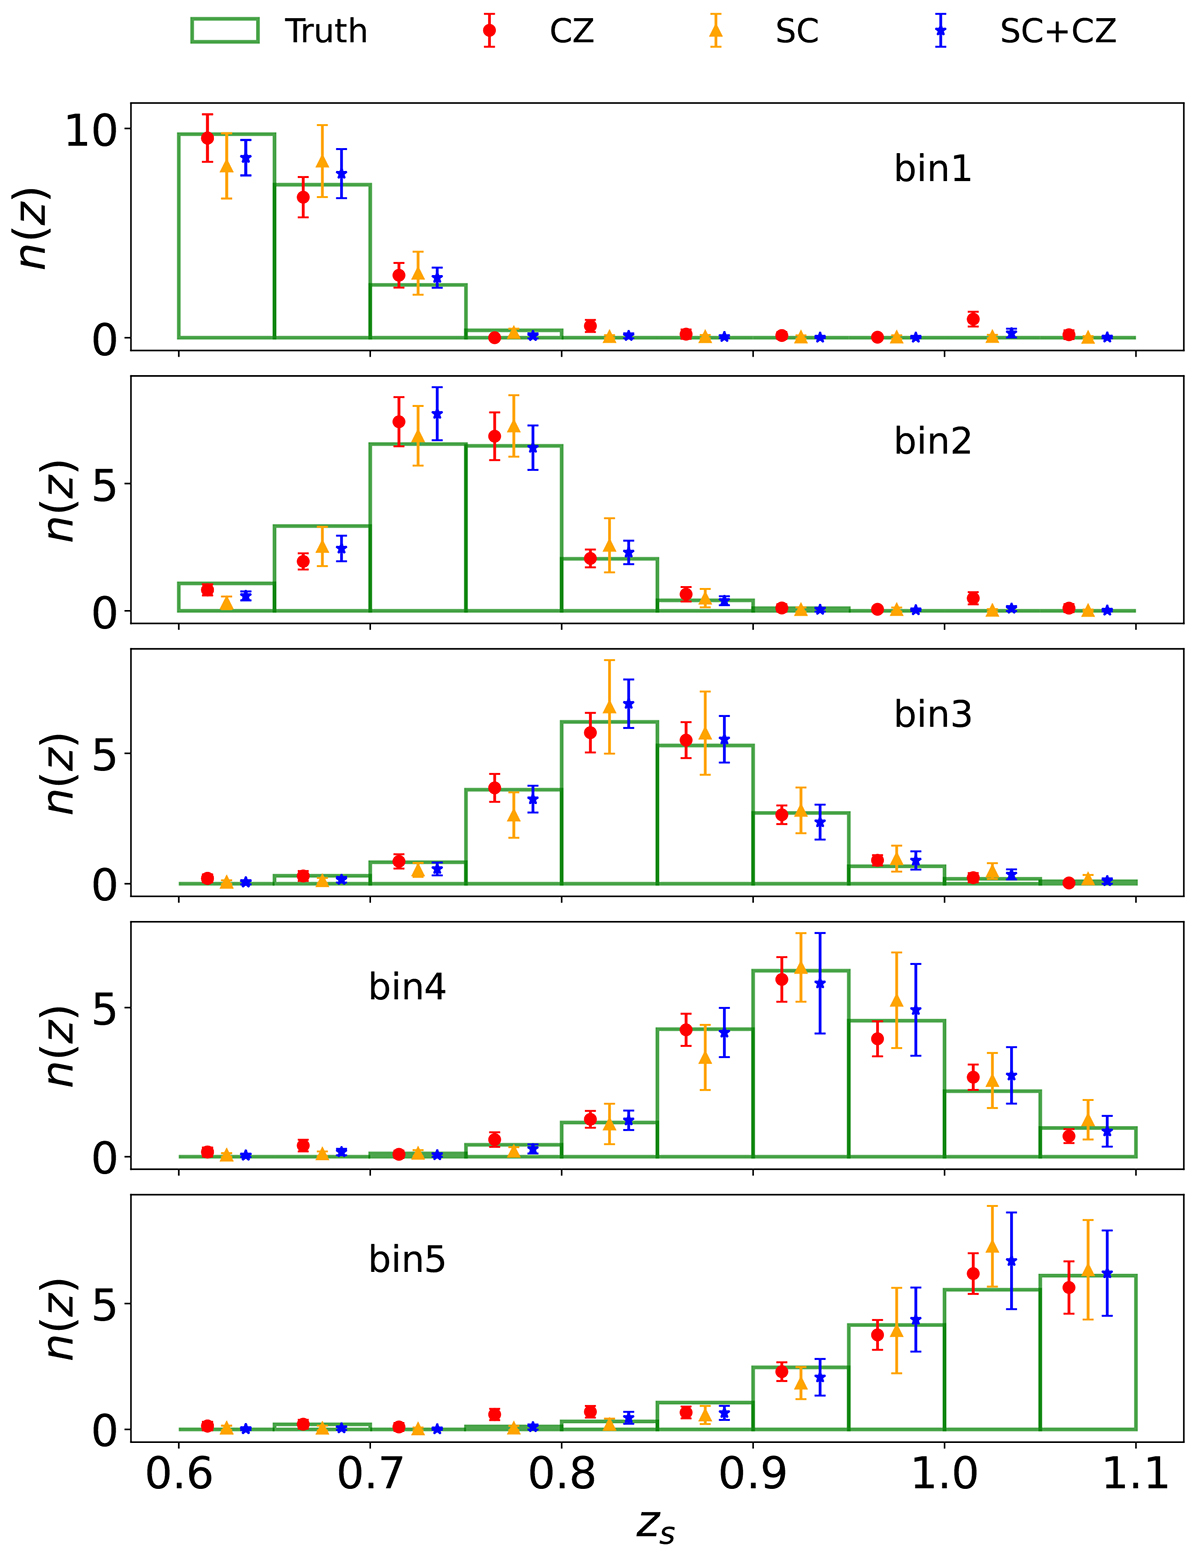
True-z distribution inferred by the clustering-based estimators [CZ (red), SC (orange), and SC+CZ (blue)] are compared with the direct mock measurement (green bars). The clustering-based estimator data points are offset horizontally for clarity. The results for five tomographic bins are shown (from top to bottom).
Current usage metrics show cumulative count of Article Views (full-text article views including HTML views, PDF and ePub downloads, according to the available data) and Abstracts Views on Vision4Press platform.
Data correspond to usage on the plateform after 2015. The current usage metrics is available 48-96 hours after online publication and is updated daily on week days.
Initial download of the metrics may take a while.