Fig. B.1.
Download original image
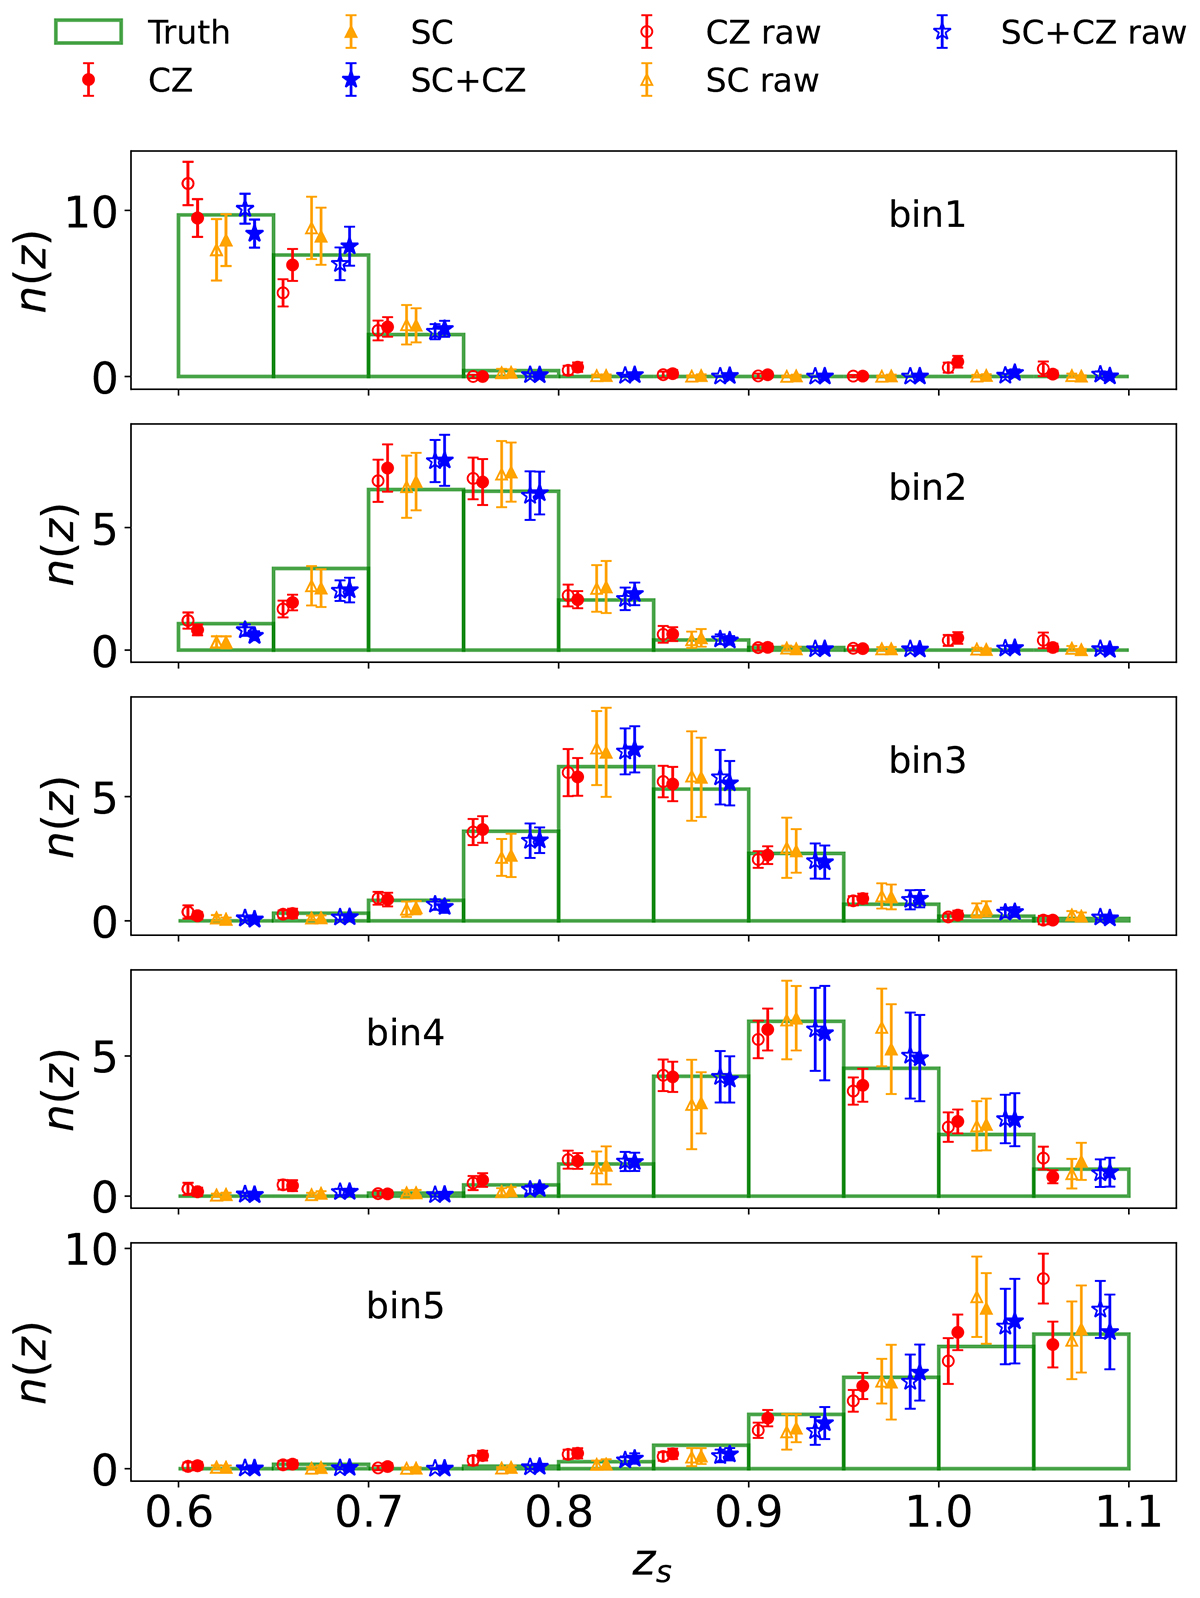
Test of the impact of the galaxies with spec-z values lying outside the redshift range [0.6,1.1]. The true-z distribution from the raw sample, which contains the outlying spec-z galaxies (unfilled markers), are compared with the cleaned sample results (filled markers). The results from SC (red), CZ (orange), and SC+CZ (blue) are displayed. The direct mock measurements (green bars) are from the cleaned sample.
Current usage metrics show cumulative count of Article Views (full-text article views including HTML views, PDF and ePub downloads, according to the available data) and Abstracts Views on Vision4Press platform.
Data correspond to usage on the plateform after 2015. The current usage metrics is available 48-96 hours after online publication and is updated daily on week days.
Initial download of the metrics may take a while.