Fig. 10.
Download original image
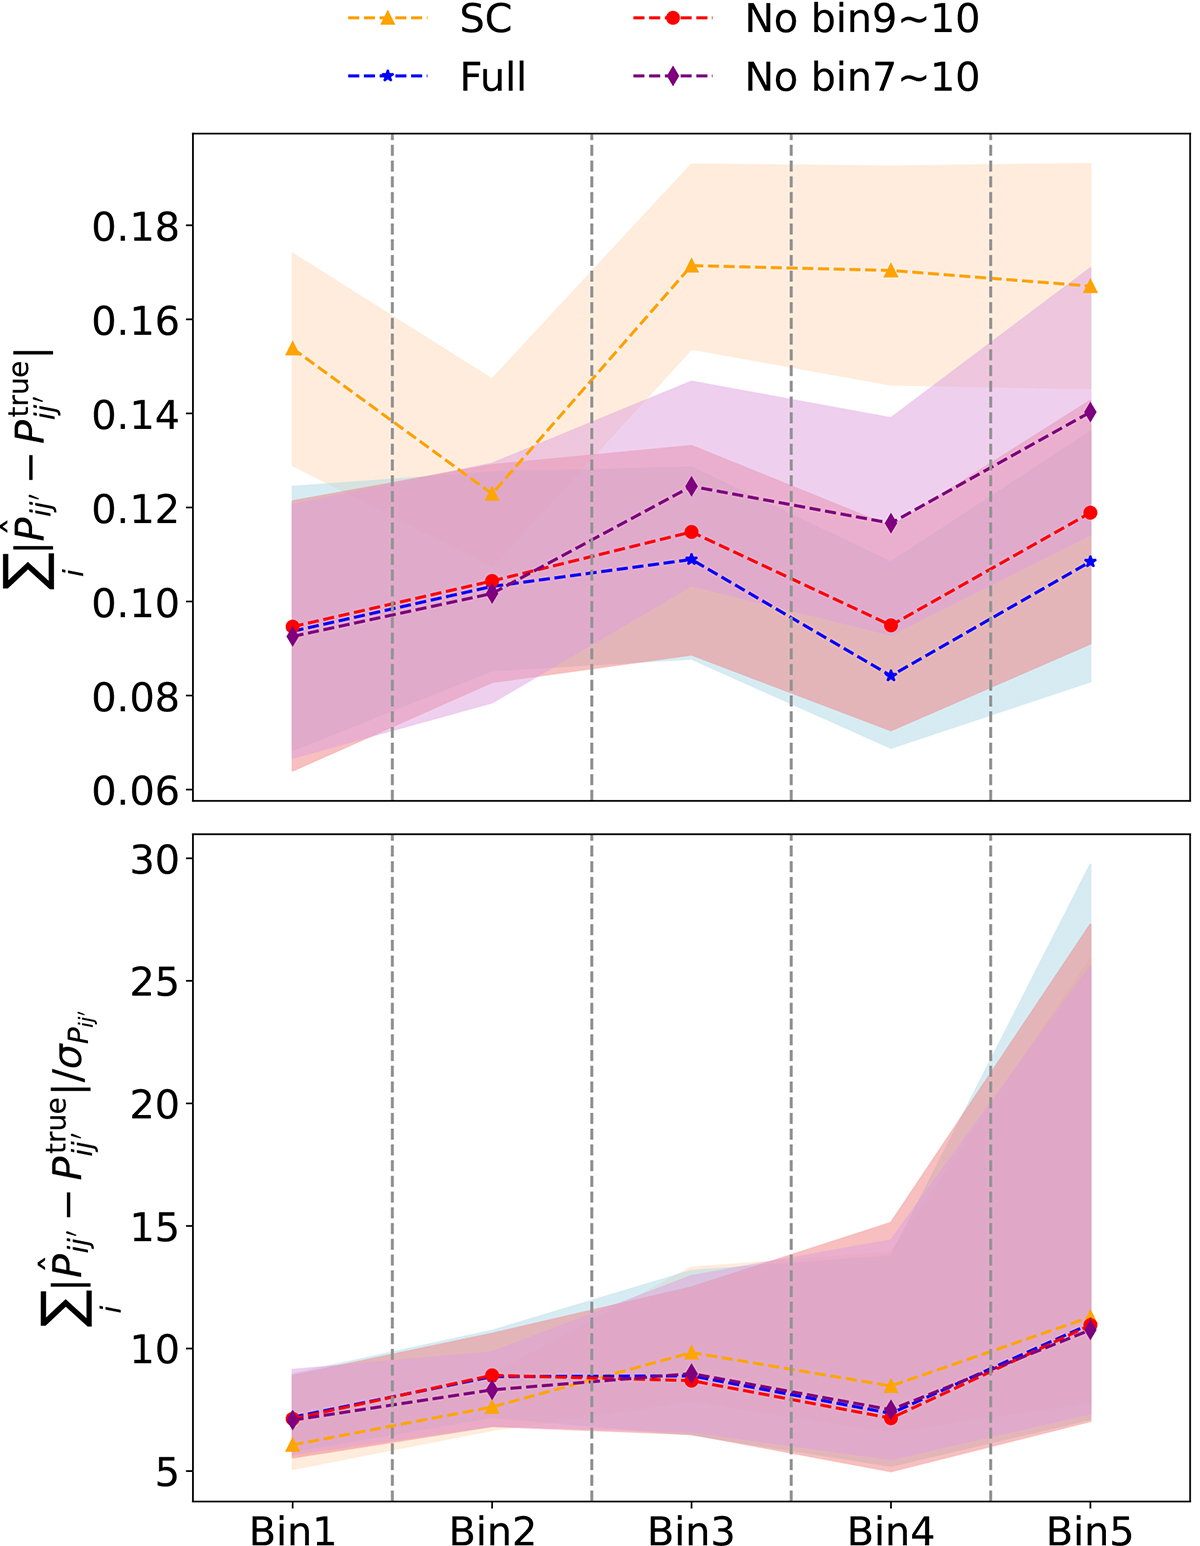
The absolute error of the true-z distribution estimated by different amount of spec-z bin data. Upper panel: ![]() , the absolute difference between the true-z distribution measured from the mock, Pij′true and the one estimated,
, the absolute difference between the true-z distribution measured from the mock, Pij′true and the one estimated, ![]() . Lower panel:
. Lower panel: ![]() the absolute difference normalized by the estimated error σPij′. In both panels, the results from full spec-z data (blue), no spec-z bin 9 and 10 (red), no spec-z bin 7 to 10 (violet), and SC only (orange) are compared. With the reduction of the number of spec-z bin data, the constraining power is weakened. When only the high-z spec-z bins are missing, the impact is mainly localized in the high-z tomographic bins with the low-z bins little affected.
the absolute difference normalized by the estimated error σPij′. In both panels, the results from full spec-z data (blue), no spec-z bin 9 and 10 (red), no spec-z bin 7 to 10 (violet), and SC only (orange) are compared. With the reduction of the number of spec-z bin data, the constraining power is weakened. When only the high-z spec-z bins are missing, the impact is mainly localized in the high-z tomographic bins with the low-z bins little affected.
Current usage metrics show cumulative count of Article Views (full-text article views including HTML views, PDF and ePub downloads, according to the available data) and Abstracts Views on Vision4Press platform.
Data correspond to usage on the plateform after 2015. The current usage metrics is available 48-96 hours after online publication and is updated daily on week days.
Initial download of the metrics may take a while.