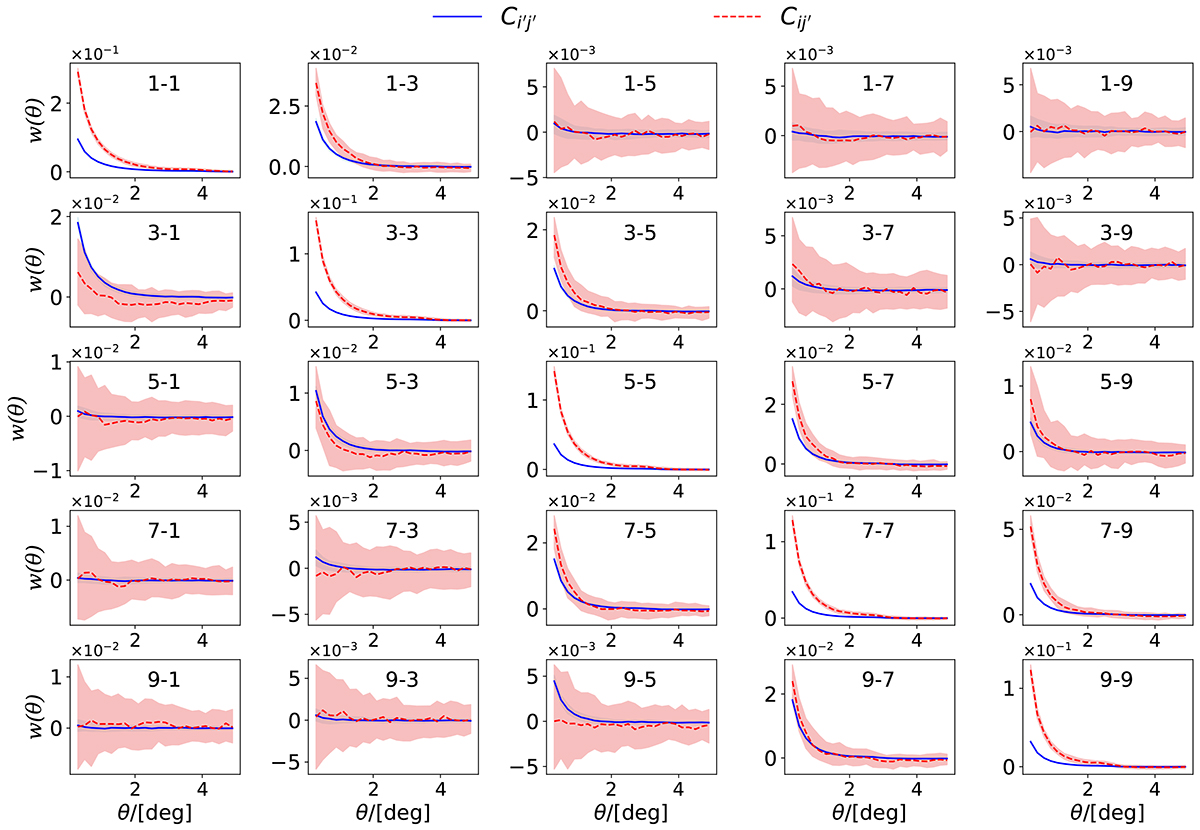
Fig. 1.
Download original image
Sample of the photo-z angular correlation function between the photo-z bin i′ and j′, Ci′j′ (blue) and the cross angular correlation function between the spec-z bin i and photo-z bin j′, Cij′ (red) to be used for true-z inference. The line and its associated color band are the median and 16 and 84 percentile among 100 mock runs. The whole redshift range [0.6,1.1] is divided into 10 photo-z bins, each of width Δzp = 0.05. This results in a true-z distribution with resolution of Δz = 0.05. The label i-j represents i′j′ for photo-z correlation function and ij′ for spec-z-photo-z cross correlation function respectively. We only show the odd bin results for clarity.
Current usage metrics show cumulative count of Article Views (full-text article views including HTML views, PDF and ePub downloads, according to the available data) and Abstracts Views on Vision4Press platform.
Data correspond to usage on the plateform after 2015. The current usage metrics is available 48-96 hours after online publication and is updated daily on week days.
Initial download of the metrics may take a while.