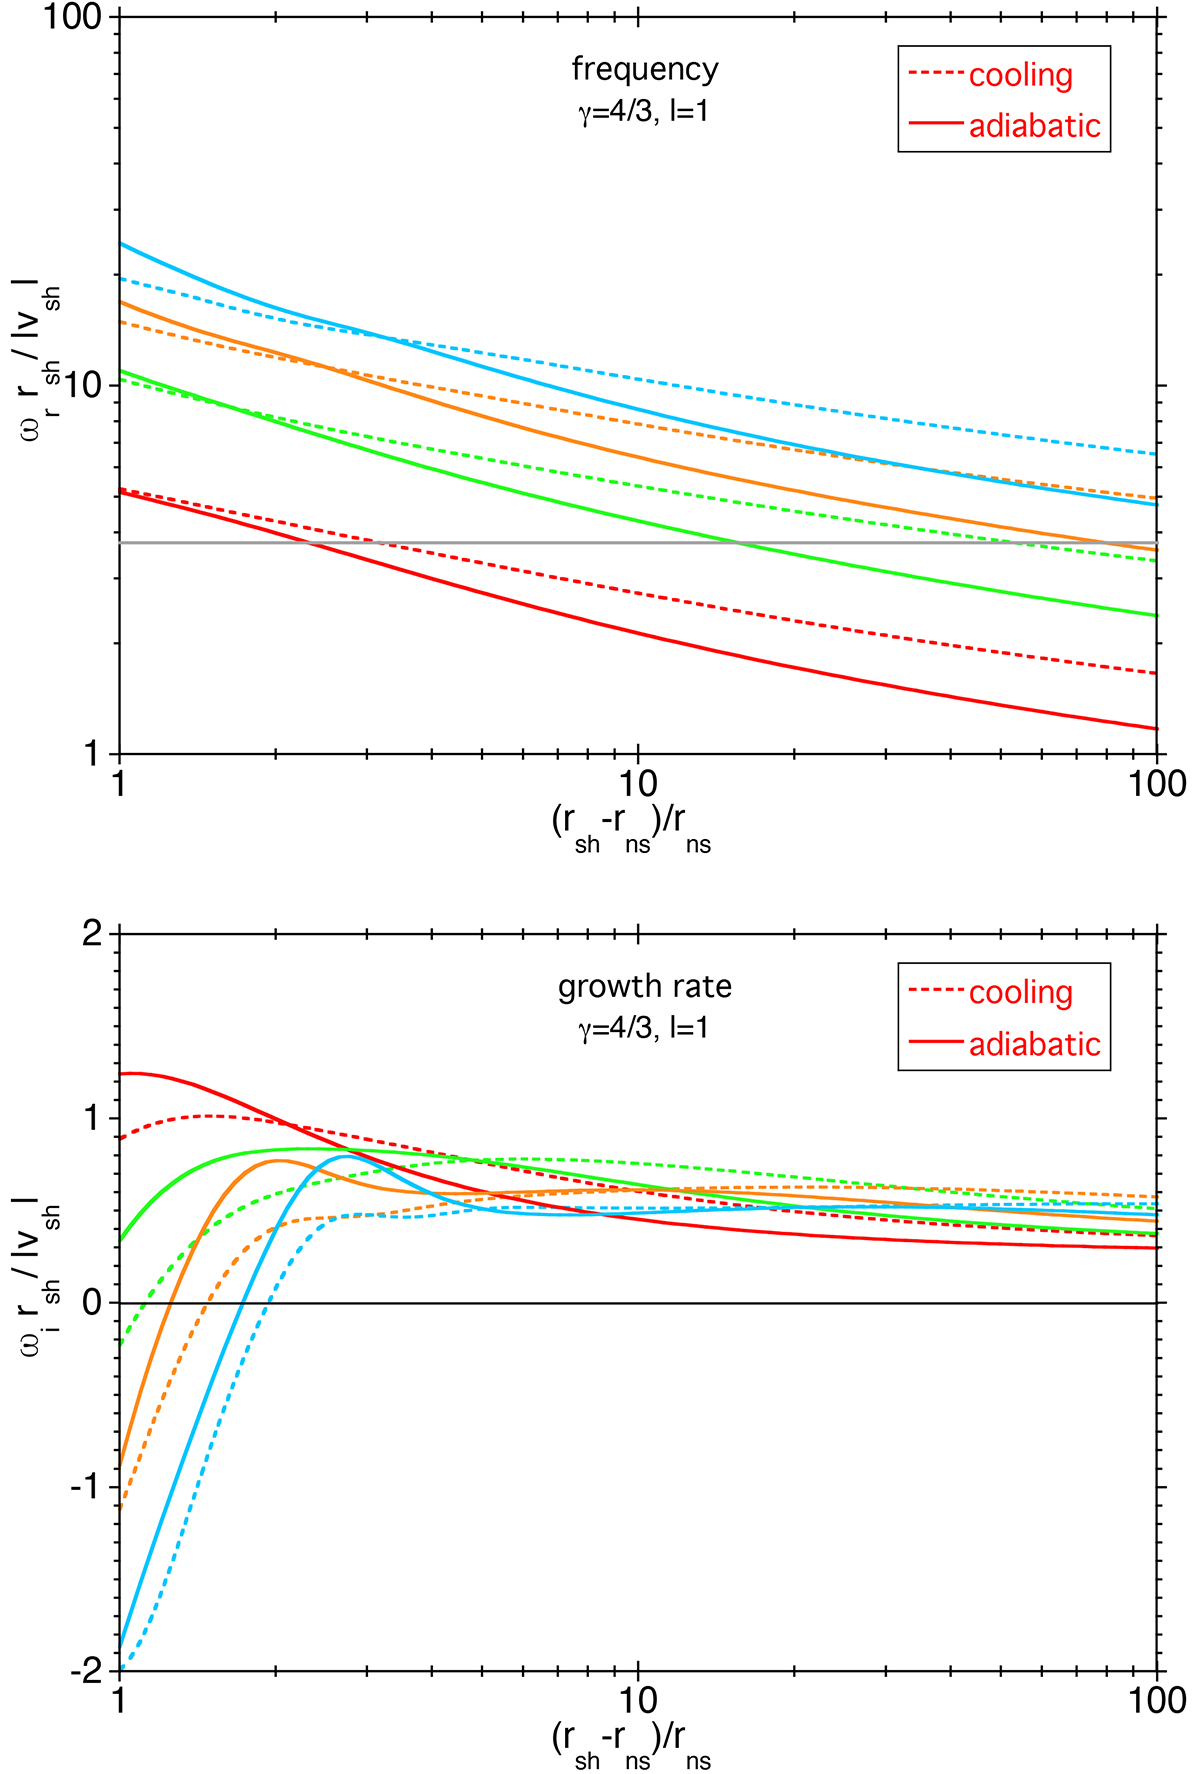
Fig. 7.
Download original image
Oscillation frequency (upper plot) and growth rate (lower plot) of the modes ℓ = 1 calculated in units of the post-shock frequency vsh/rsh, for γ = 4/3, as a function of the shock distance in the model with cooling using (α, β) = (3/2, 5/2) (dashed lines) and in the adiabatic approximation (solid lines). The fundamental mode (in red) and the first three overtones (green, orange, blue) are displayed. The grey horizontal line in the upper plot indicates the Lamb frequency at the shock. The fundamental mode becomes dominated by higher overtones as its frequency becomes too low for acoustic propagation (![]() ).
).
Current usage metrics show cumulative count of Article Views (full-text article views including HTML views, PDF and ePub downloads, according to the available data) and Abstracts Views on Vision4Press platform.
Data correspond to usage on the plateform after 2015. The current usage metrics is available 48-96 hours after online publication and is updated daily on week days.
Initial download of the metrics may take a while.