Fig. 10.
Download original image
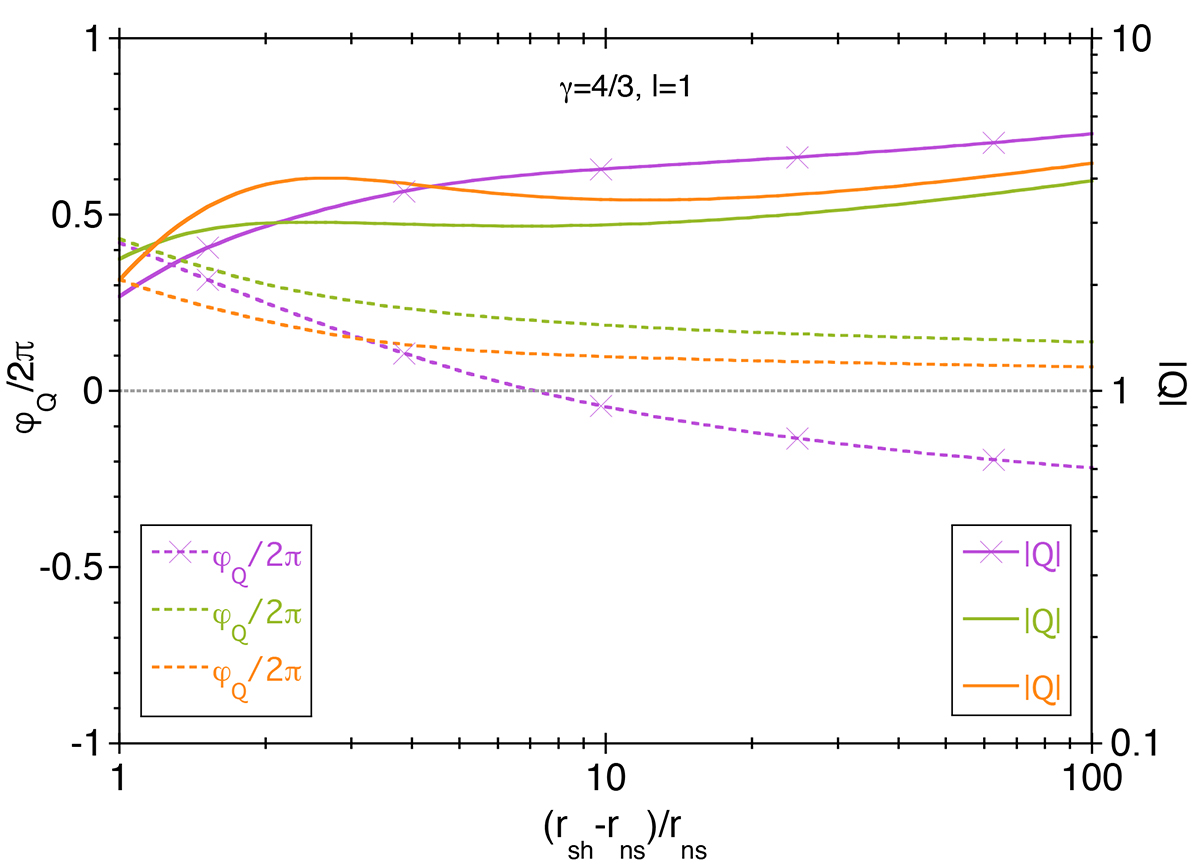
Amplitude |𝒬| (solid lines) and normalised phase φ𝒬/2π (dashed lines) of the complex amplification factor associated through Eqs. (86), (87) to the fundamental eigenfrequency ω calculated with cooling (purple lines with crosses) and in the adiabatic approximation (green lines), using the same adiabatic estimate of the advection time ![]() as that in Eq. (79). The orange line shows |𝒬| and φ𝒬/2π deduced from the analytic estimate (orange lines) using Eq. (82) with ω satisfying Eq. (83).
as that in Eq. (79). The orange line shows |𝒬| and φ𝒬/2π deduced from the analytic estimate (orange lines) using Eq. (82) with ω satisfying Eq. (83).
Current usage metrics show cumulative count of Article Views (full-text article views including HTML views, PDF and ePub downloads, according to the available data) and Abstracts Views on Vision4Press platform.
Data correspond to usage on the plateform after 2015. The current usage metrics is available 48-96 hours after online publication and is updated daily on week days.
Initial download of the metrics may take a while.