Open Access
Fig. B.1
Download original image
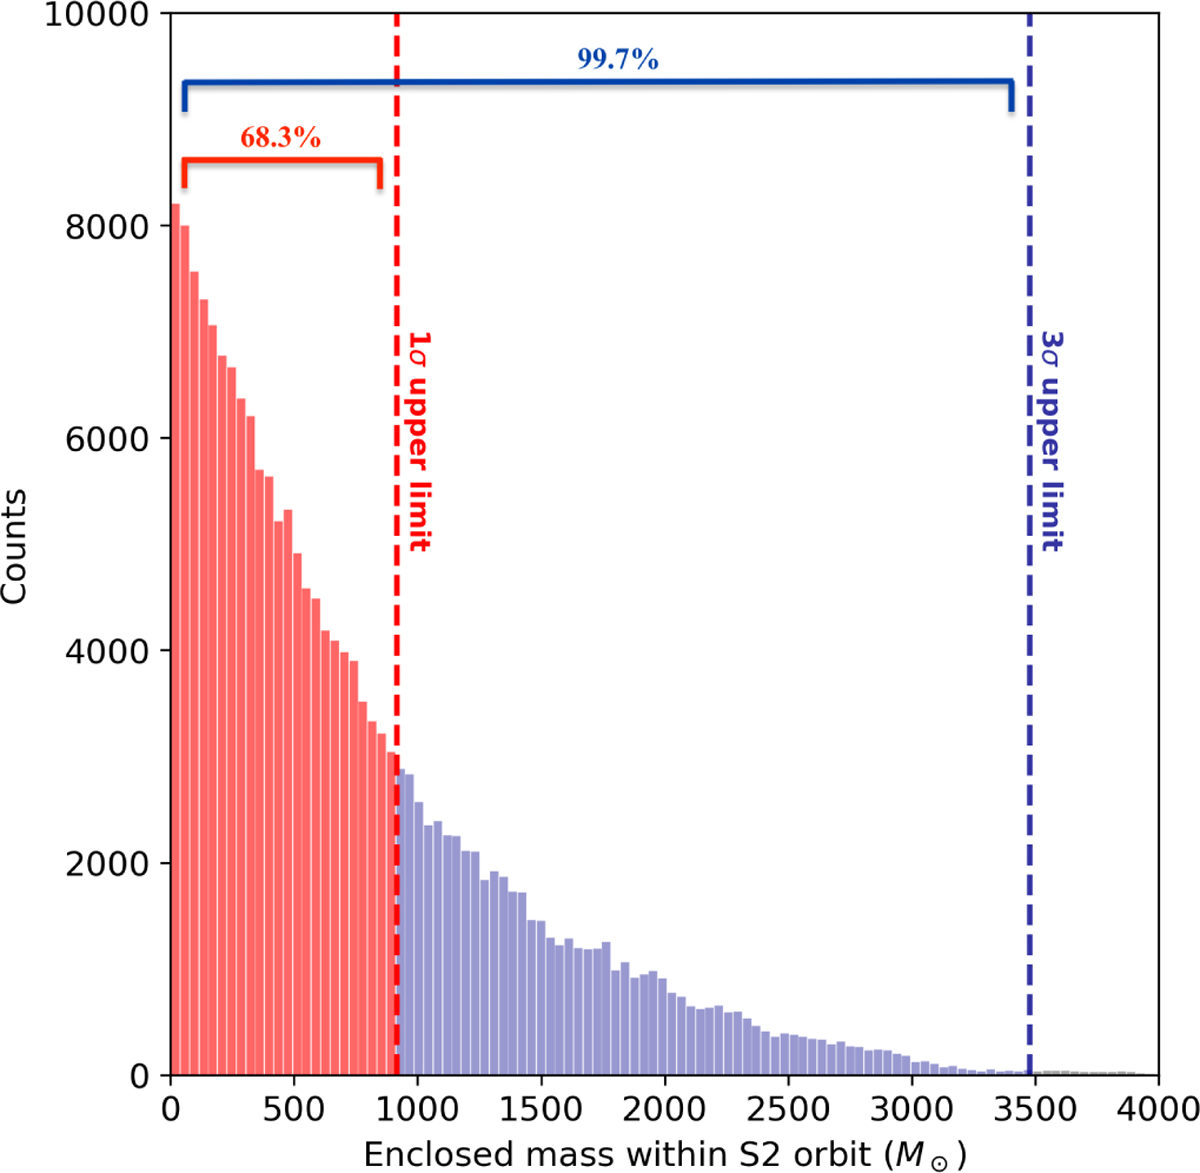
Example of posterior distribution on the enclosed mass within S2’s orbit, for an MCMC analysis with 200 000 realizations, showing how the 1σ and 3σ upper limits are derived. This example corresponds to the case of a multi-star fit with the stars S2, S29, S38, S55 for a power-law density profile with slope s = −2.2.
Current usage metrics show cumulative count of Article Views (full-text article views including HTML views, PDF and ePub downloads, according to the available data) and Abstracts Views on Vision4Press platform.
Data correspond to usage on the plateform after 2015. The current usage metrics is available 48-96 hours after online publication and is updated daily on week days.
Initial download of the metrics may take a while.