Open Access
Fig. 4.
Download original image
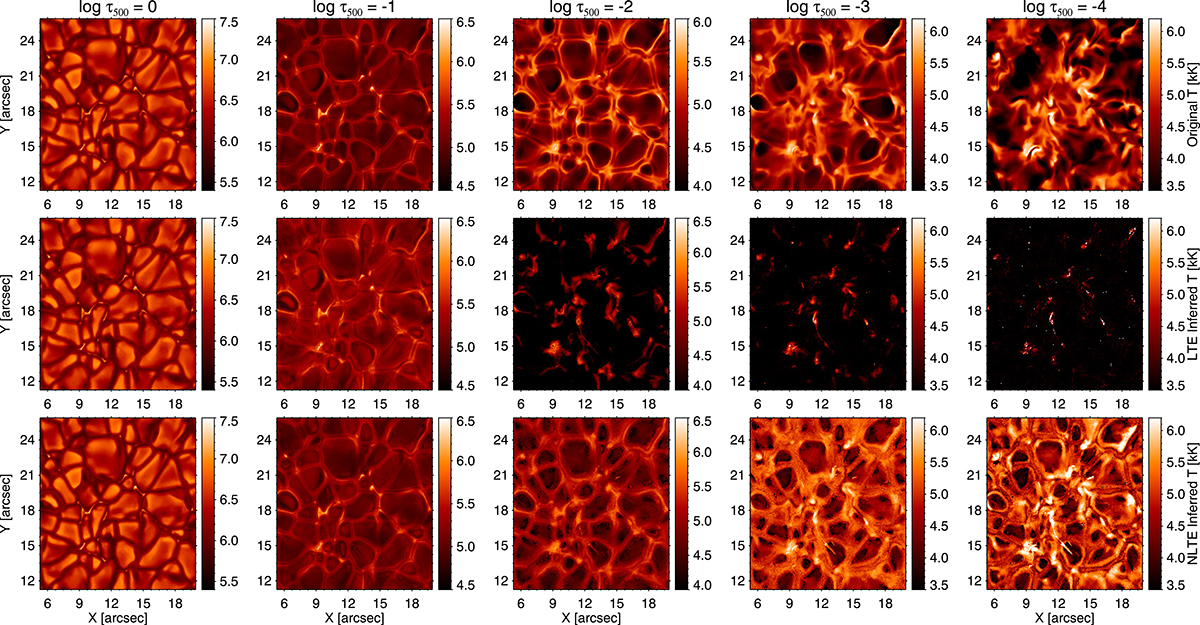
Spatial variation of the temperature at different optical depths (columns from left to right). Rows display, from top to bottom, the original atmosphere, the one inferred assuming LTE and that from NLTE inversions, respectively. The spatial domain corresponds to that highlighted by the square in Figure 3.
Current usage metrics show cumulative count of Article Views (full-text article views including HTML views, PDF and ePub downloads, according to the available data) and Abstracts Views on Vision4Press platform.
Data correspond to usage on the plateform after 2015. The current usage metrics is available 48-96 hours after online publication and is updated daily on week days.
Initial download of the metrics may take a while.