Fig. 3.
Download original image
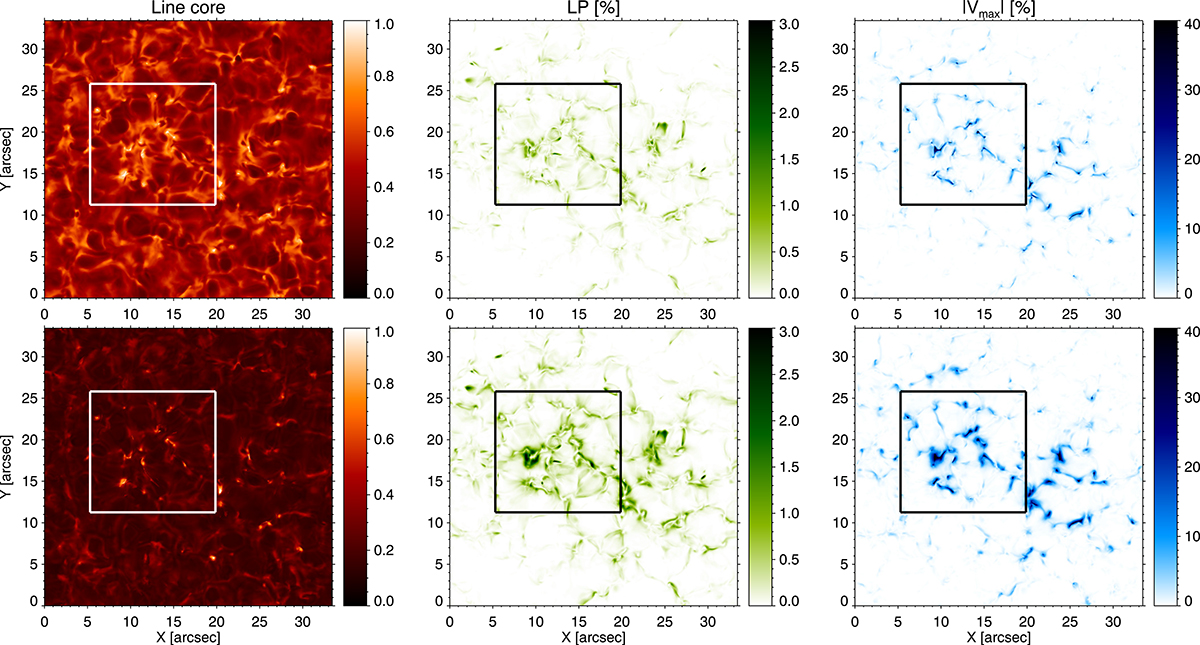
Spatial distribution of spectral features. From left to right, we show the spatial distribution of line core intensity, maximum linear polarisation, and maximum circular polarisation signals for the Si I 10827 Å spectral line. The top row corresponds to the results from the LTE computation, while the bottom panels display the results of the NLTE case. The region enclosed by the white/black square corresponds to the FOV used for the inversion analysis in Section 4.
Current usage metrics show cumulative count of Article Views (full-text article views including HTML views, PDF and ePub downloads, according to the available data) and Abstracts Views on Vision4Press platform.
Data correspond to usage on the plateform after 2015. The current usage metrics is available 48-96 hours after online publication and is updated daily on week days.
Initial download of the metrics may take a while.