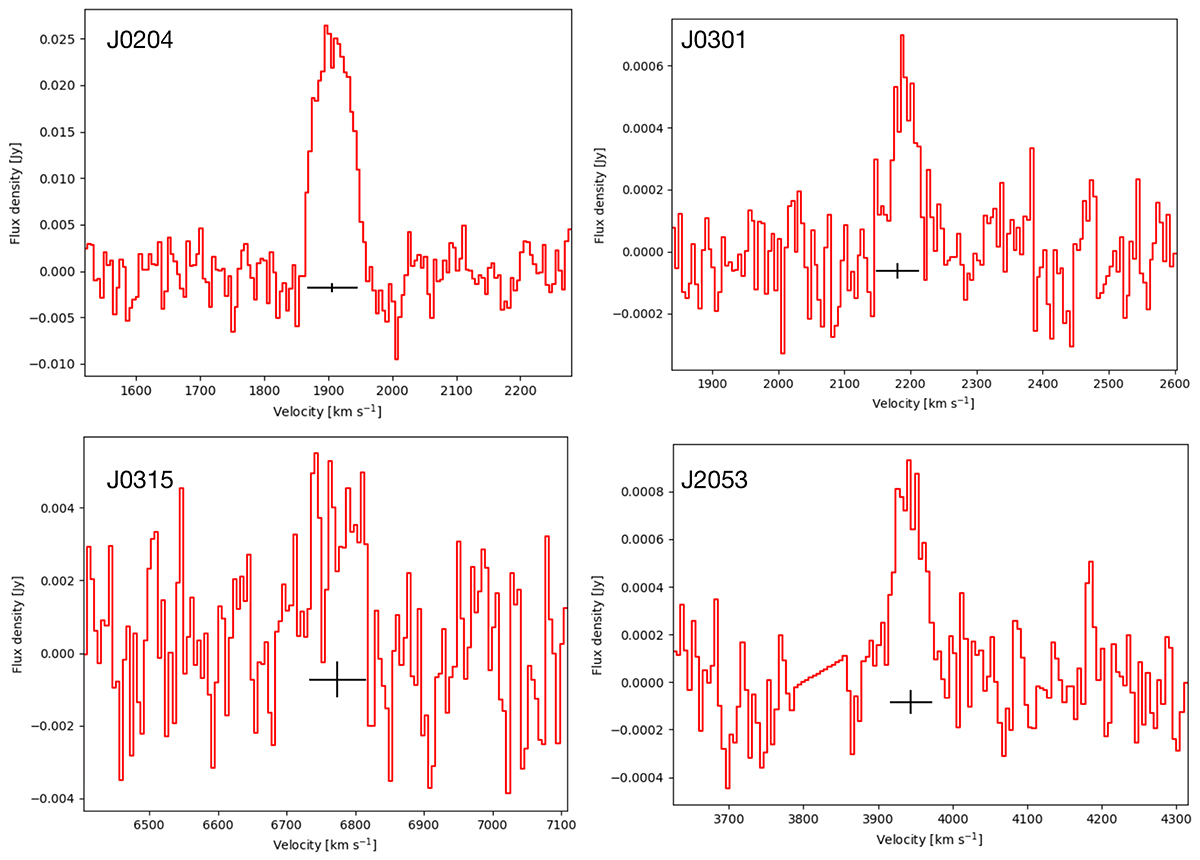
Fig. C.1.
Download original image
Spectra of the VLA BC-configuration BCD detections at a velocity resolution of 5 km s−1. The horizontal line over-plotted below each spectrum indicates the W20 velocity range. The black vertical lines on the W20 line are the VHI calculated, using the Vsysw20 method from (Reynolds et al. 2021). VHI (Vsysw20 method) and W20 measurements for each galaxy in this figure are shown in Table 2.
Current usage metrics show cumulative count of Article Views (full-text article views including HTML views, PDF and ePub downloads, according to the available data) and Abstracts Views on Vision4Press platform.
Data correspond to usage on the plateform after 2015. The current usage metrics is available 48-96 hours after online publication and is updated daily on week days.
Initial download of the metrics may take a while.