Fig. 5
Download original image
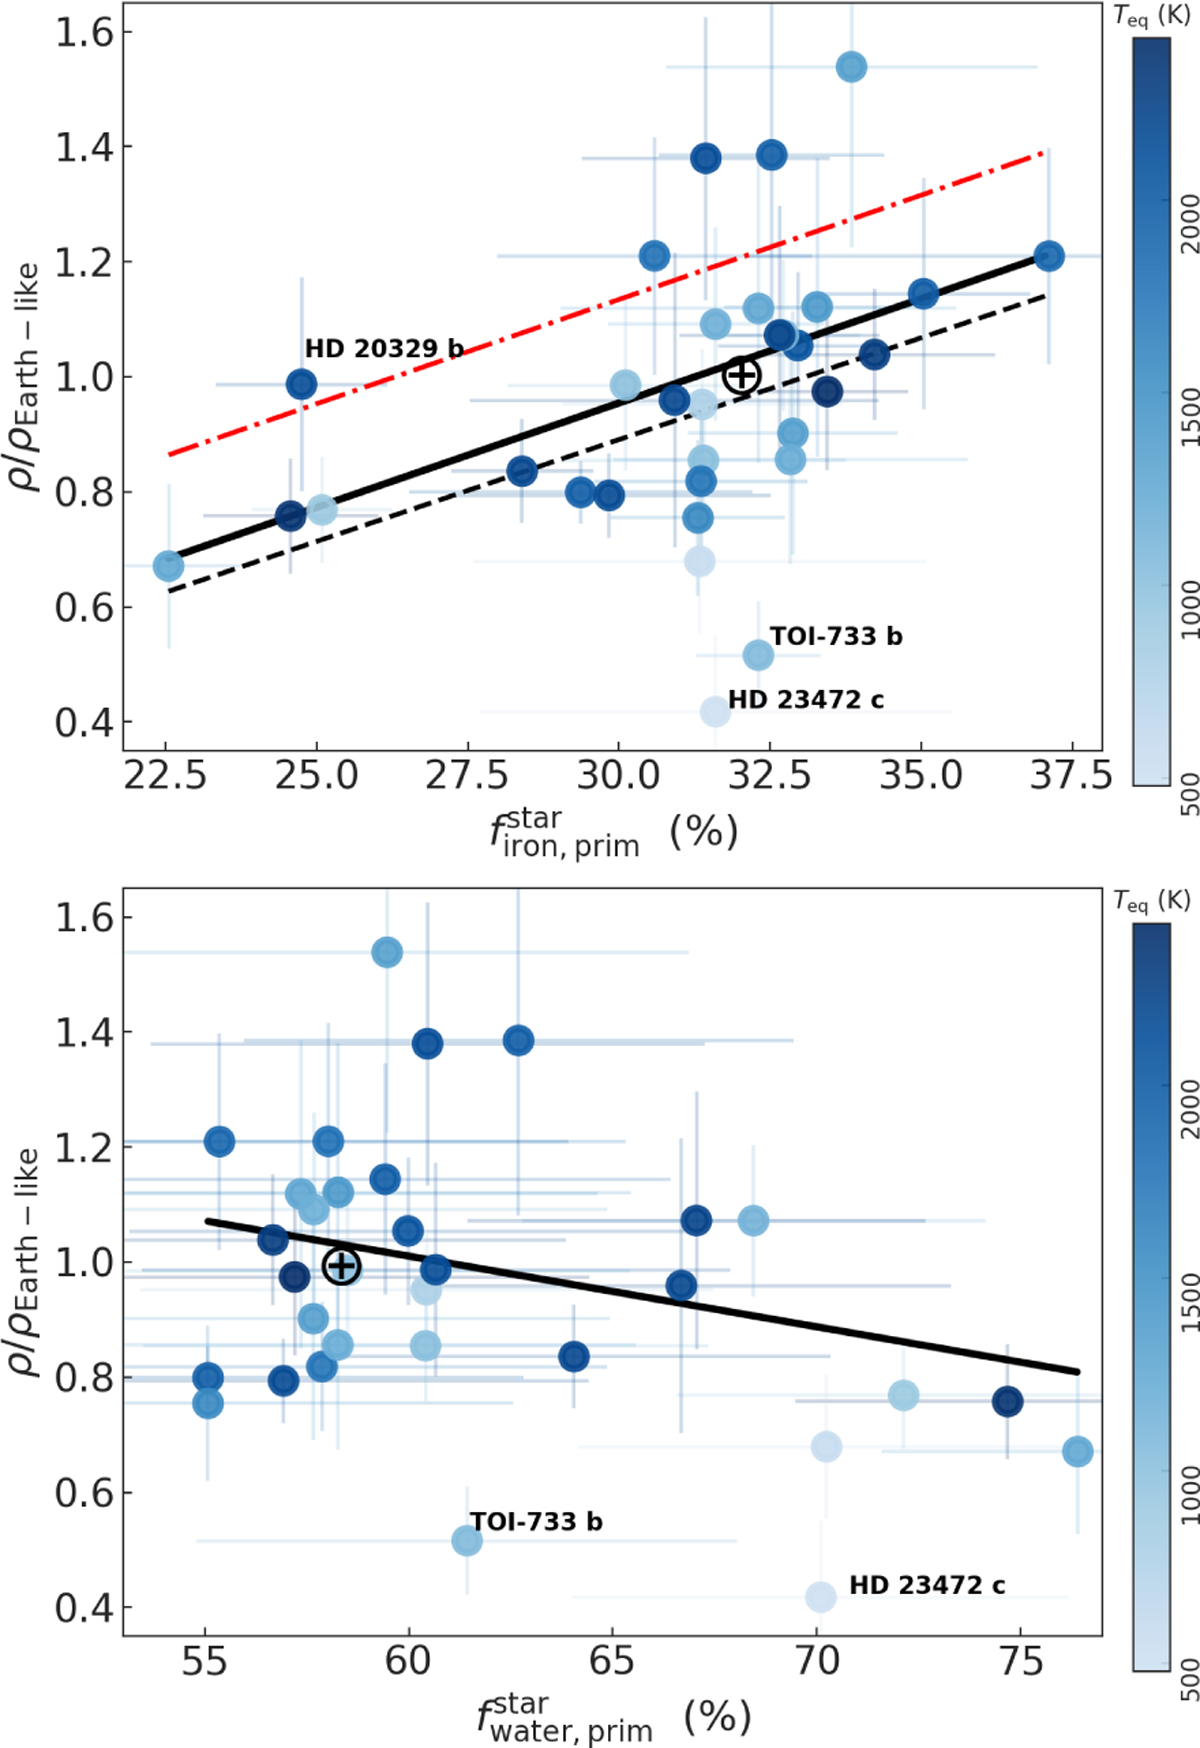
Scaled density of planets as a function of ![]() (top) and
(top) and ![]() (bottom) color-coded by the equilibrium temperature of the planets. The positions of Earth is indicated with its symbols in black. The black solid lines represent the results of OLS regression without considering TOI-733 b and HD 23472 c. The red dashed-dotted line represent the visual separation between super-Earths and super-Mercuries. The black dashed line represent the result of the linear regression without considering TOI-733 b, HD 23472 c and the super-Mercuries located above the red line (p-value of about 10−5).
(bottom) color-coded by the equilibrium temperature of the planets. The positions of Earth is indicated with its symbols in black. The black solid lines represent the results of OLS regression without considering TOI-733 b and HD 23472 c. The red dashed-dotted line represent the visual separation between super-Earths and super-Mercuries. The black dashed line represent the result of the linear regression without considering TOI-733 b, HD 23472 c and the super-Mercuries located above the red line (p-value of about 10−5).
Current usage metrics show cumulative count of Article Views (full-text article views including HTML views, PDF and ePub downloads, according to the available data) and Abstracts Views on Vision4Press platform.
Data correspond to usage on the plateform after 2015. The current usage metrics is available 48-96 hours after online publication and is updated daily on week days.
Initial download of the metrics may take a while.