Open Access
Fig. 1
Download original image
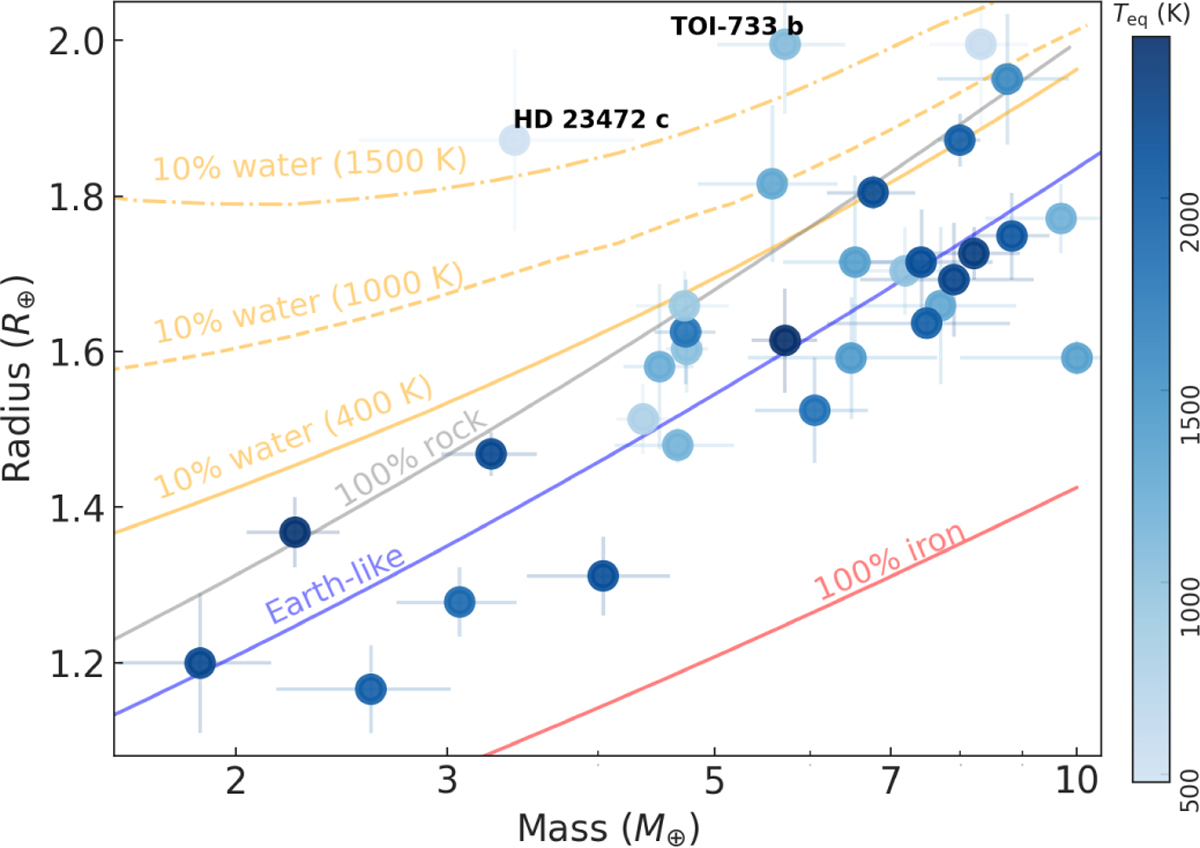
Distribution of planets in the mass–radius diagram color-coded by their Teq. The curves display the expected mass–radius relationship for different compositions taken from Luo et al. (2024).
Current usage metrics show cumulative count of Article Views (full-text article views including HTML views, PDF and ePub downloads, according to the available data) and Abstracts Views on Vision4Press platform.
Data correspond to usage on the plateform after 2015. The current usage metrics is available 48-96 hours after online publication and is updated daily on week days.
Initial download of the metrics may take a while.