Fig. 9
Download original image
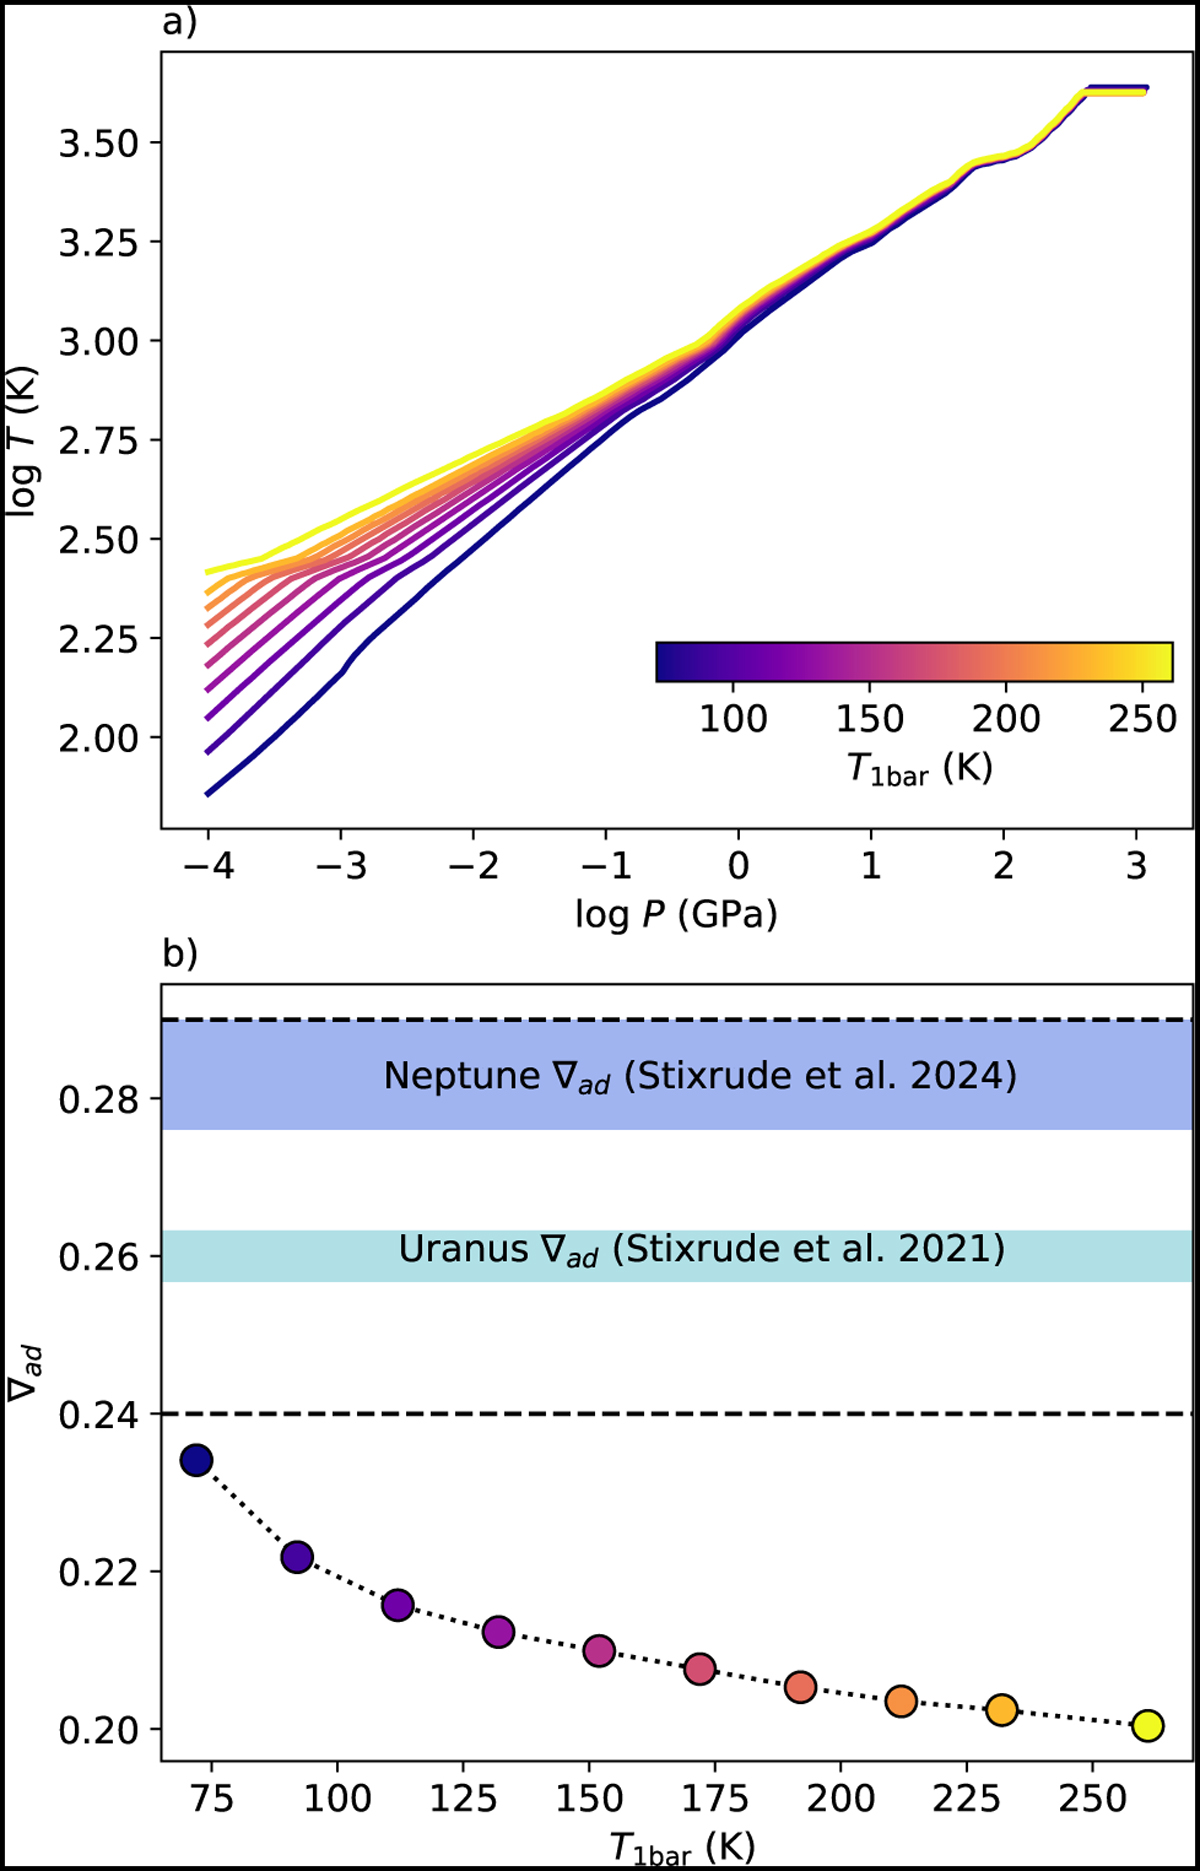
Comparison of adiabatic gradient obtained from models with phase separation with values used by Stixrude et al. (2021) and James & Stixrude (2024). (a) Interior P–T profiles for Neptune for different T1 bar temperatures. The metallicity Z1 = Zatm is varied with T1 bar according to the Berg24 phase diagram, while Z2 essentially stays at ∼0.7. (b) Bulk volume-weighted-adiabatic gradient over temperature since the start of demixing (right side of the x-axis) to the present temperature. Blue bands show the range of values for ∇ad found by Stixrude et al. (2021) for Uranus and James & Stixrude (2024) for Neptune to match the cooling times, amongst their range of tested values between 0.24 and 0.29 (dashed lines).
Current usage metrics show cumulative count of Article Views (full-text article views including HTML views, PDF and ePub downloads, according to the available data) and Abstracts Views on Vision4Press platform.
Data correspond to usage on the plateform after 2015. The current usage metrics is available 48-96 hours after online publication and is updated daily on week days.
Initial download of the metrics may take a while.