Fig. 6

Download original image
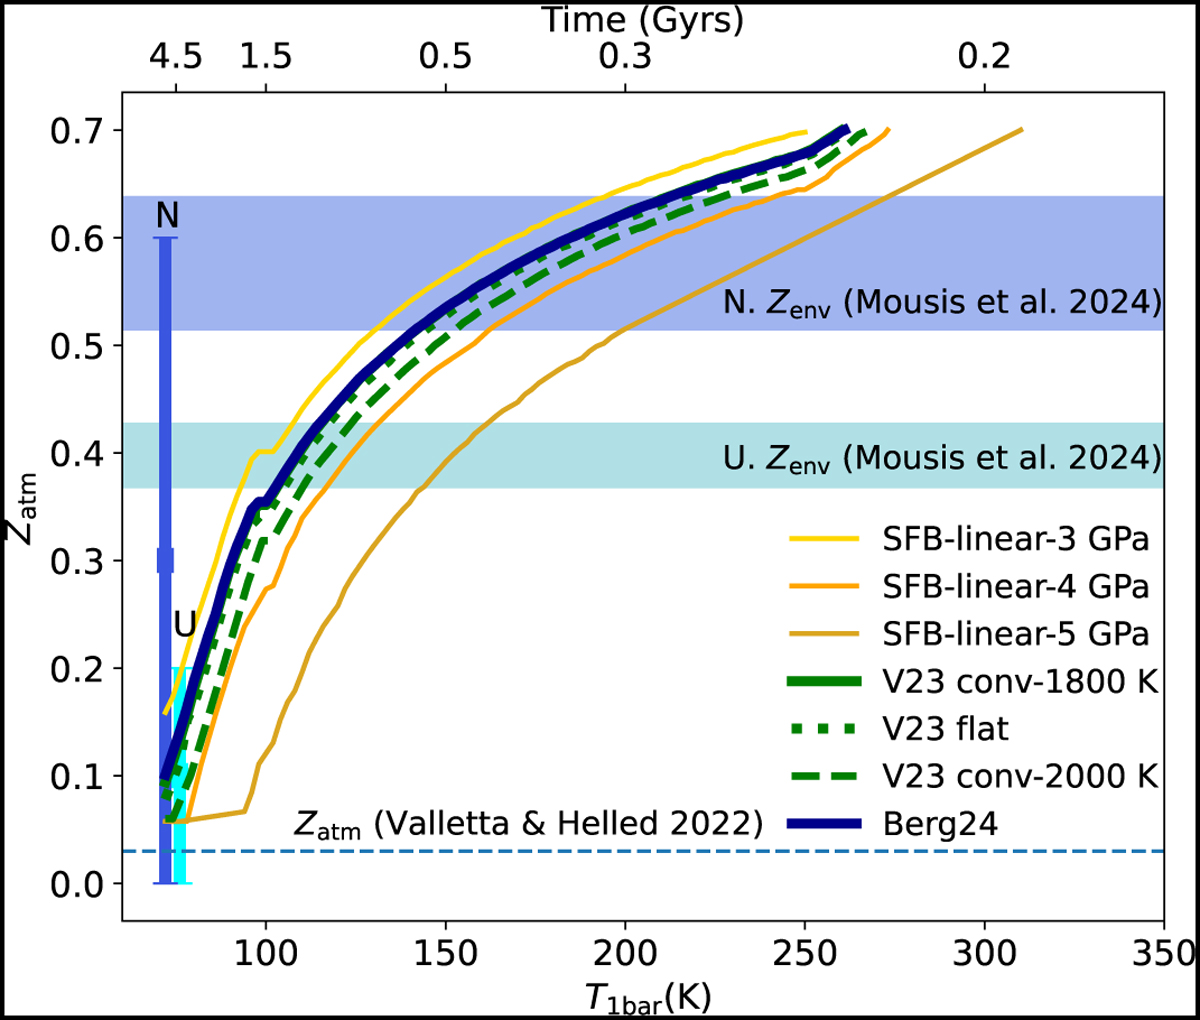
Atmospheric water abundance as a function of T1 bar for each of the seven phase diagrams. The V23 conv-1800 K curve is hidden by the Berg24 curve. The change of slope near 100 K is due to the switch to the ideal-gas EoS for T < 100 K (see Sect. 2.1). Vertical uncertainty ranges on the left show the outer envelope water abundance from the structure models of Nettelmann et al. (2013). The top horizontal axis shows times corresponding to a model of Neptune’s thermal evolution from Nettelmann et al. (2013). The dashed horizontal line shows the metal- licity of the outer envelope found by Valletta & Helled (2022) using planet formation models. The horizontal shaded areas show the bulk oxygen enrichment predicted by Mousis et al. (2024) for the envelopes of Uranus and Neptune (Zenv), which we converted to mass fractions.
Current usage metrics show cumulative count of Article Views (full-text article views including HTML views, PDF and ePub downloads, according to the available data) and Abstracts Views on Vision4Press platform.
Data correspond to usage on the plateform after 2015. The current usage metrics is available 48-96 hours after online publication and is updated daily on week days.
Initial download of the metrics may take a while.


