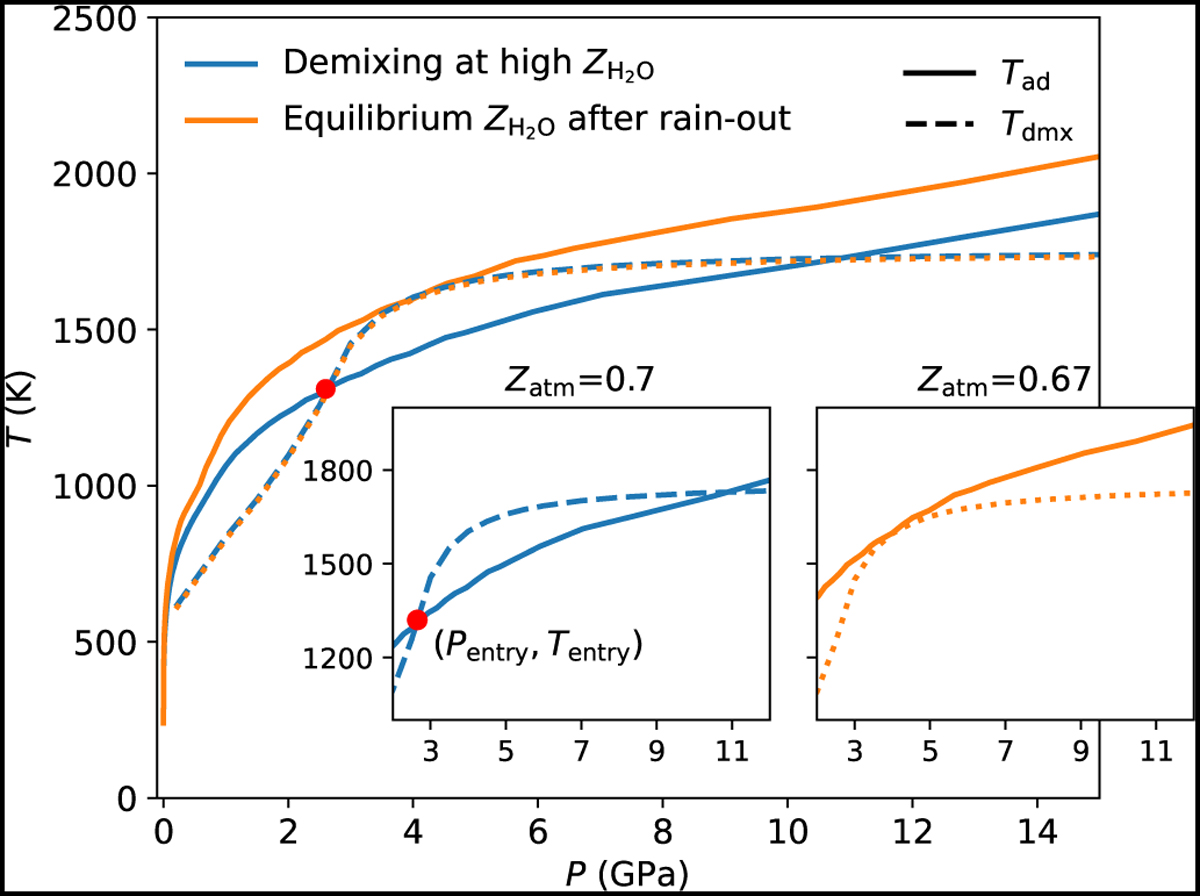
Fig. 5
Download original image
Determination of water equilibrium abundance. Solid lines and dashed lines denote adiabats and demixing curves, respectively, the latter being obtained from the V23 conv-1800 K phase diagram shown in Fig. 4. We start with an overlap region where Tad < Tdmx and an initial water abundance of Z = 0.7 throughout the entire planet. Then, Z is decreased until the overlap region disappears and Tad ≥ Tdmx at all pressures. Here, the equilibrium abundance found is 0.67. The orange adiabat is the profile with a 0.67 outer-envelope abundance. The obtained abundance is high in this example because T1bar = 240 K, implying a rather warm adiabat in a young planet. The demixing region for the case with Zatm = 0.7 is much larger compared to that typically encountered in our simulations. This choice was made for visual clarity (see text for more details).
Current usage metrics show cumulative count of Article Views (full-text article views including HTML views, PDF and ePub downloads, according to the available data) and Abstracts Views on Vision4Press platform.
Data correspond to usage on the plateform after 2015. The current usage metrics is available 48-96 hours after online publication and is updated daily on week days.
Initial download of the metrics may take a while.