Fig. 4
Download original image
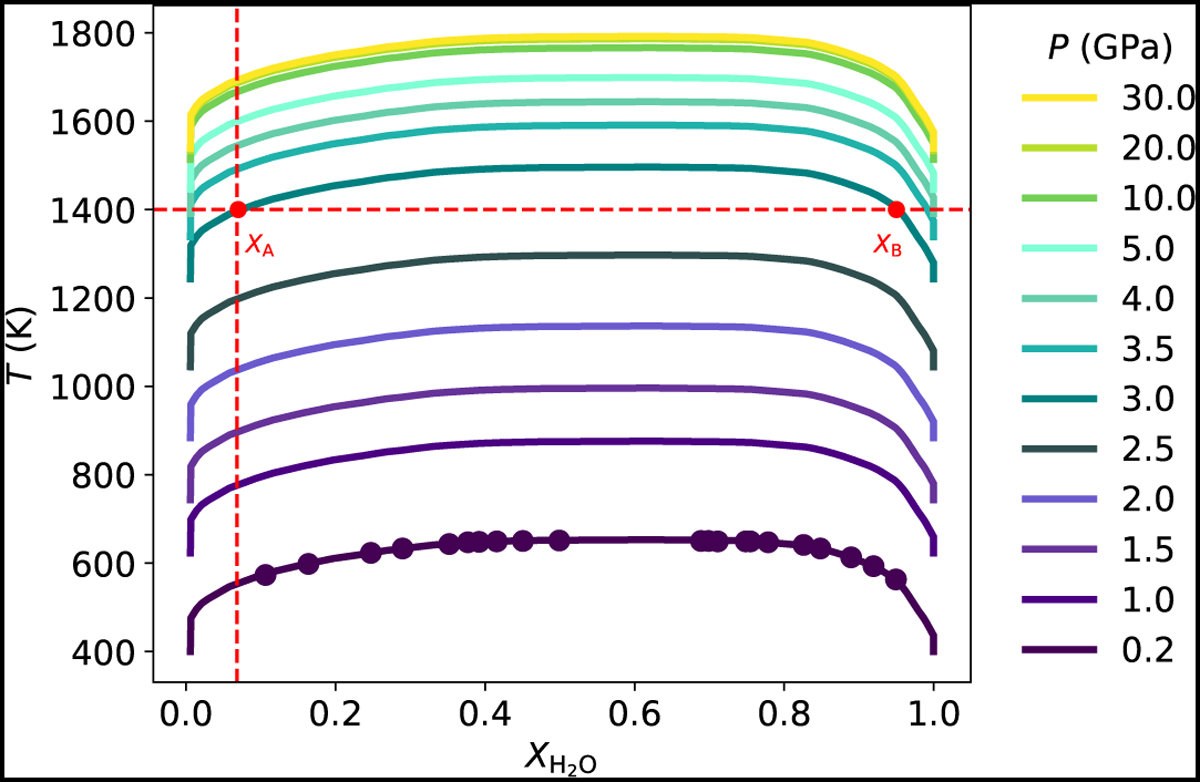
Example of a phase diagram Tdmx(![]() ) based on the shape of the 0.2 GPa isobar according to the experimental data (purple points) of Seward & Franck (1981). Higher isobars are obtained by shifting the 0.2 GPa curve vertically according to the given critical curve Tdmx(P, 0.5). Here, the V23 conv-1800 K case is shown. xA and xB show the coexisting particle fractions at 3 GPa and 1400 K. The waterpoor equilibrium abundance xA is used to compute the atmospheric abundance.
) based on the shape of the 0.2 GPa isobar according to the experimental data (purple points) of Seward & Franck (1981). Higher isobars are obtained by shifting the 0.2 GPa curve vertically according to the given critical curve Tdmx(P, 0.5). Here, the V23 conv-1800 K case is shown. xA and xB show the coexisting particle fractions at 3 GPa and 1400 K. The waterpoor equilibrium abundance xA is used to compute the atmospheric abundance.
Current usage metrics show cumulative count of Article Views (full-text article views including HTML views, PDF and ePub downloads, according to the available data) and Abstracts Views on Vision4Press platform.
Data correspond to usage on the plateform after 2015. The current usage metrics is available 48-96 hours after online publication and is updated daily on week days.
Initial download of the metrics may take a while.