Fig. 3
Download original image
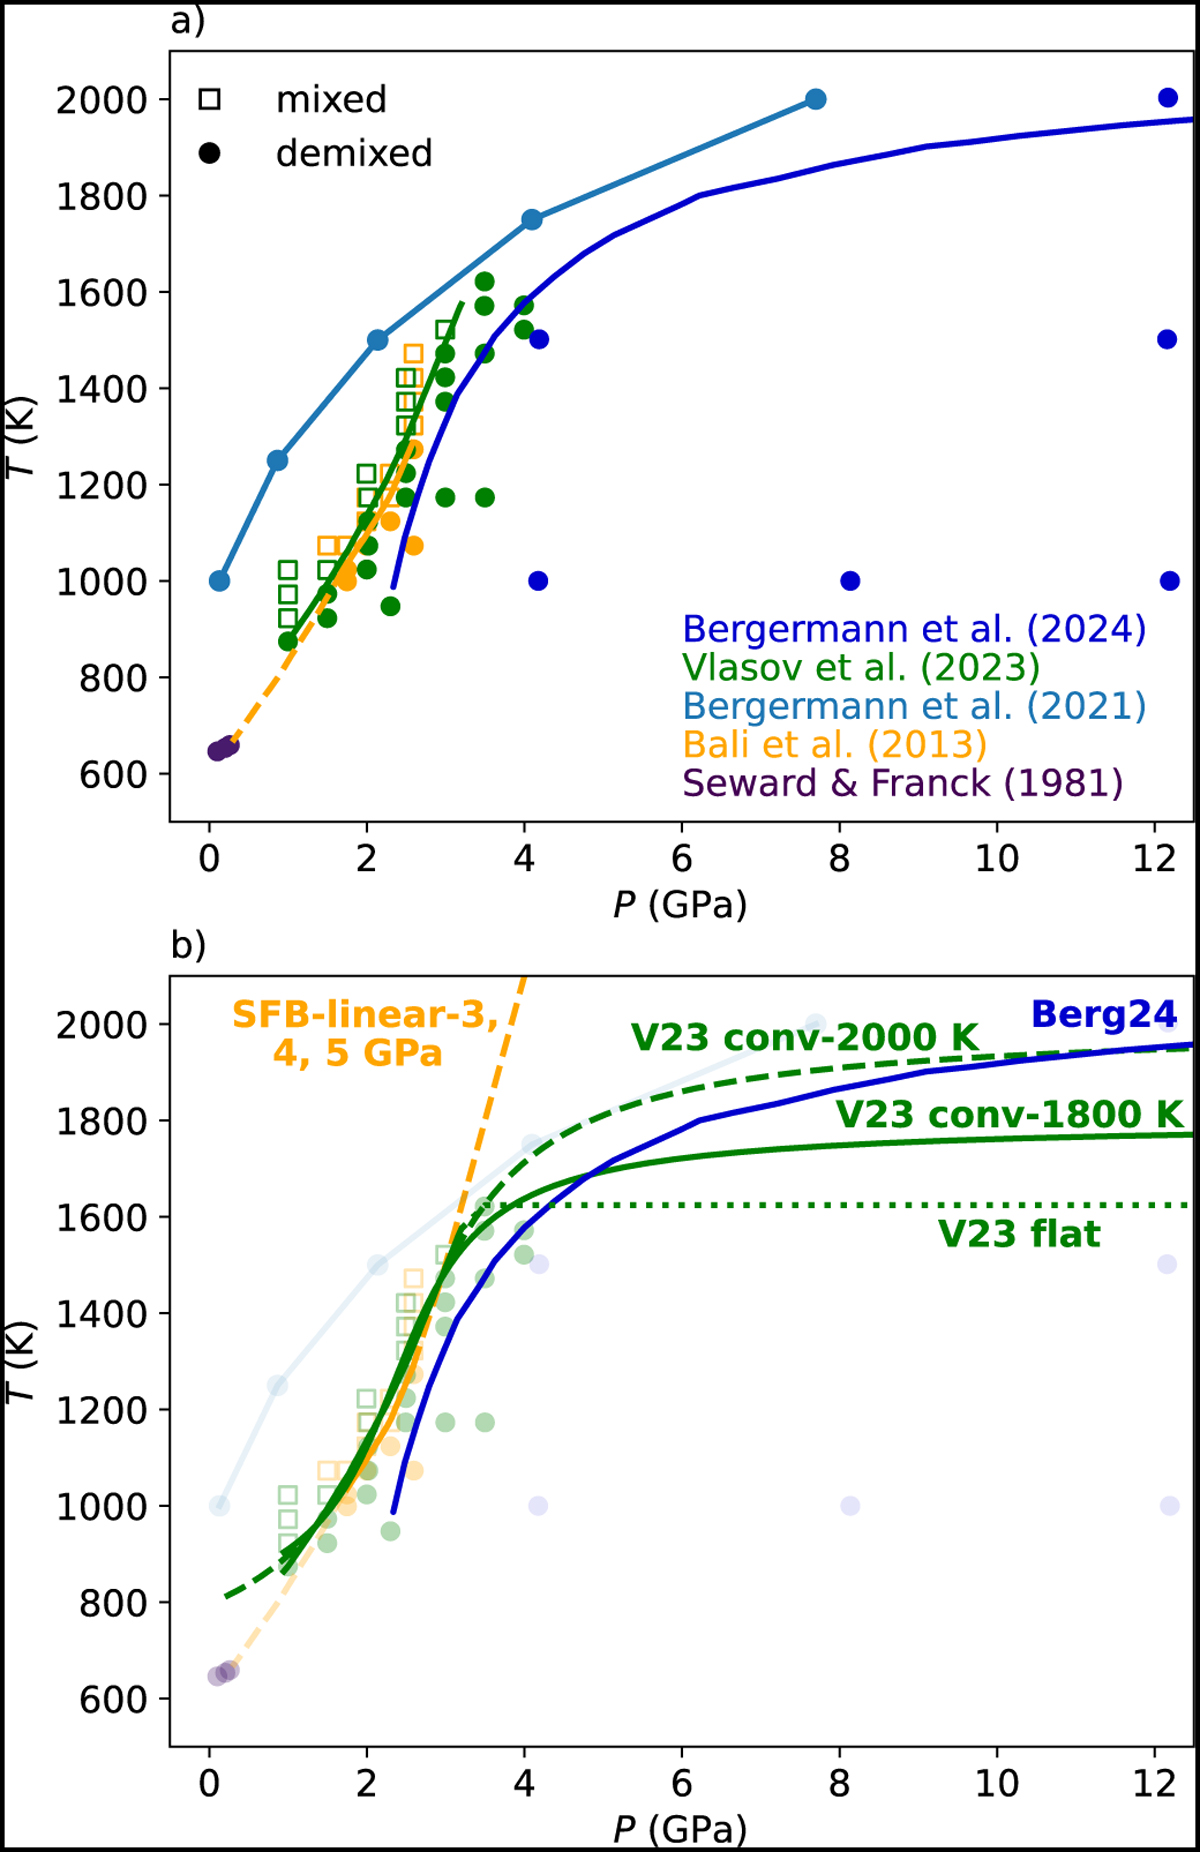
Experimental data and theoretical predictions on H2–H2O miscibility. (a) Experimental data for 1:1 H2–H2O miscibility from Seward & Franck (1981) (purple), Bali et al. (2013) (yellow), and Vlasov et al. (2023) (green); and the computational predictions of Bergermann et al. (2021) (light blue curve) and Bergermann et al. (2024) (blue curve). Filled symbols correspond to the coexistence of two phases, while empty squares refer to complete mixing of H2 and H2O. The solid lines indicate the fit of the corresponding data points. (b) Extrapolated critical curves based on the data shown in panel a) and used to construct the phase diagrams (see text for details). The linear extrapolations of the data by Bali et al. (2013) beyond 3 GPa and up to 4 and 5 GPa are shown by the dashed yellow line. The three different extensions beyond 3.5 GPa for the Vlasov et al. (2023) data (flat, V23 conv-1800 K, and V23 conv-2000 K) are shown by green dotted, solid, and dashed lines, respectively. Finally, the blue curve is from Bergermann et al. (2024).
Current usage metrics show cumulative count of Article Views (full-text article views including HTML views, PDF and ePub downloads, according to the available data) and Abstracts Views on Vision4Press platform.
Data correspond to usage on the plateform after 2015. The current usage metrics is available 48-96 hours after online publication and is updated daily on week days.
Initial download of the metrics may take a while.