Fig. 4
Download original image
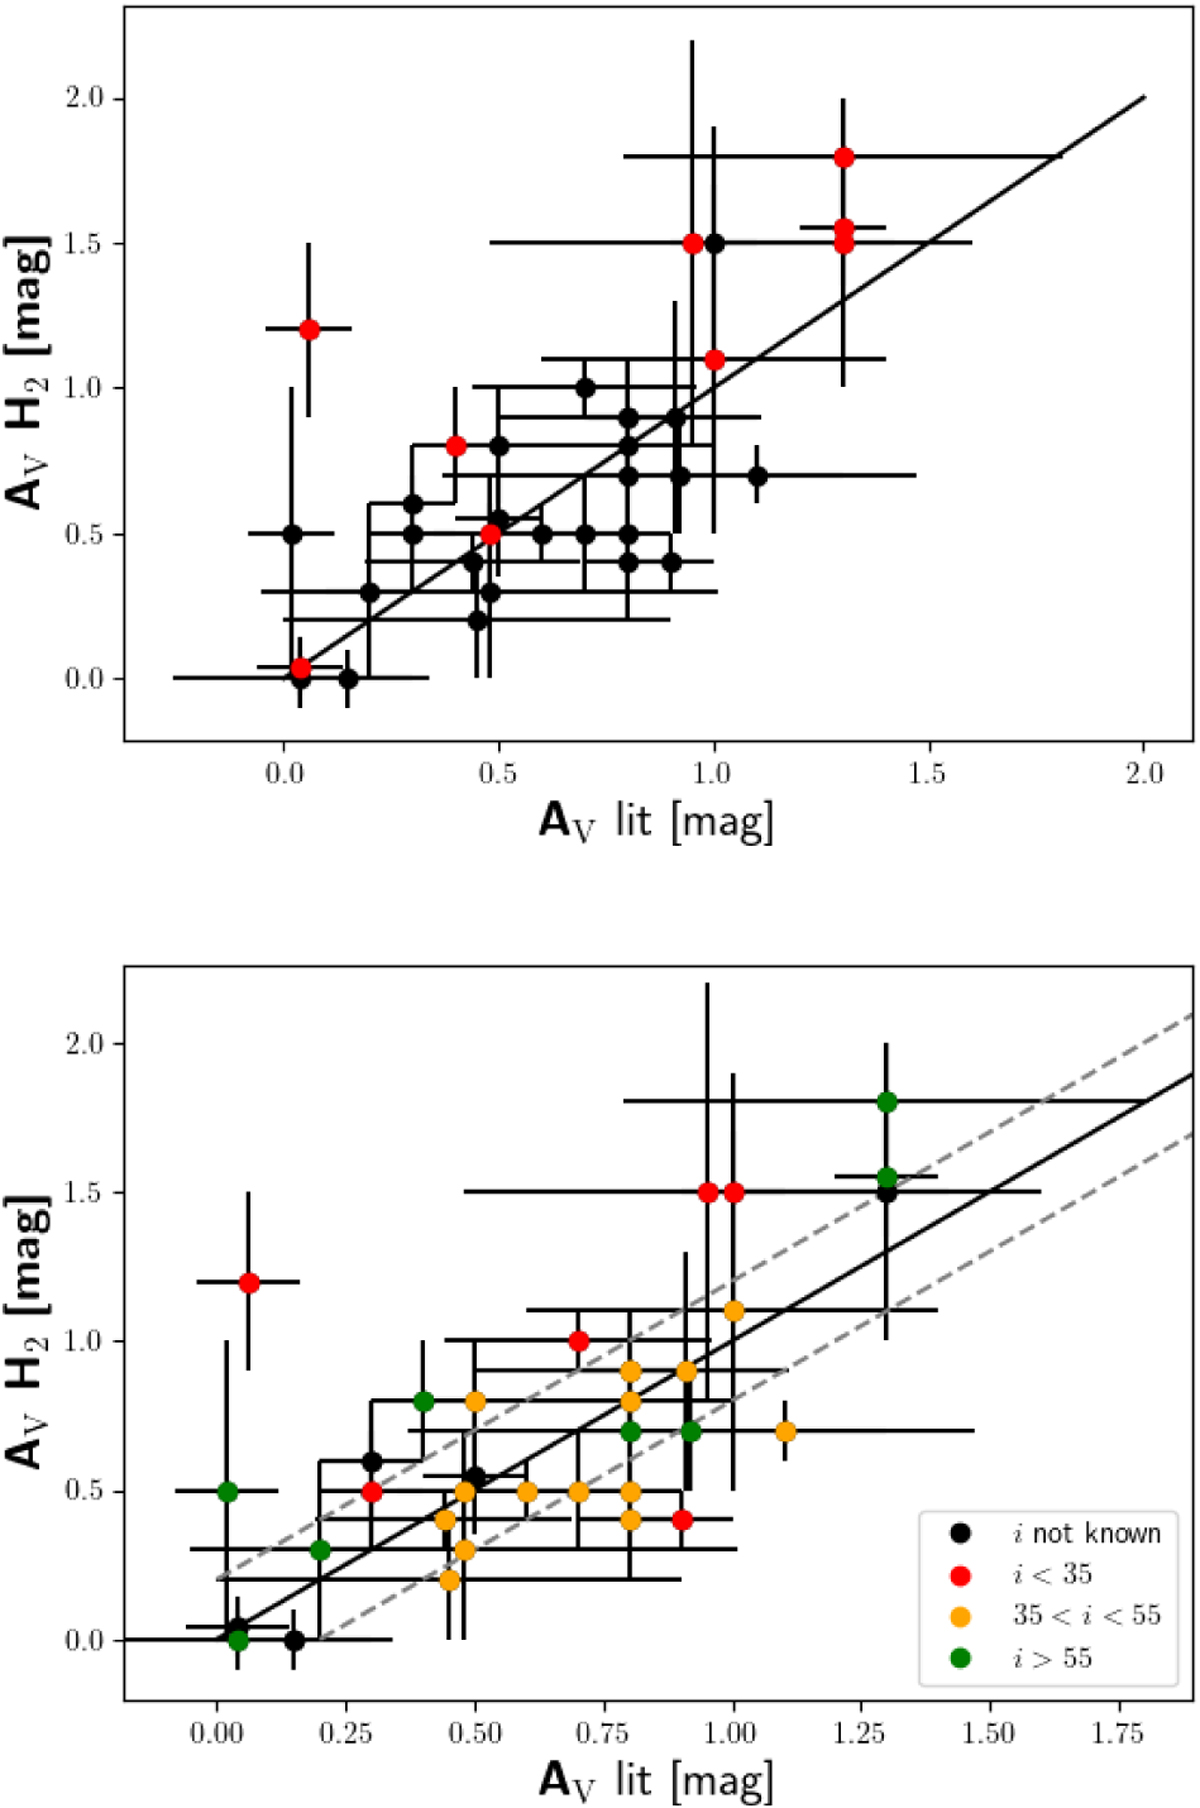
Comparison of our AV values for fixed RV = 3.1 to the literature values. Top: when all three progressions could be used to infer the mean AV, the stars are represented by red dots, and when two progressions could be used, they are shown with black dots (progression [0,1] omitted). The black line indicates identity. The four stars with literature values of AV=0.0 mag are offset by 0.02 mag for clarity of their error bars. Bottom: same as above, but color-coded with the disk inclination. The dashed gray lines indicate errors of 0.2 mag.
Current usage metrics show cumulative count of Article Views (full-text article views including HTML views, PDF and ePub downloads, according to the available data) and Abstracts Views on Vision4Press platform.
Data correspond to usage on the plateform after 2015. The current usage metrics is available 48-96 hours after online publication and is updated daily on week days.
Initial download of the metrics may take a while.