Fig. A.1
Download original image
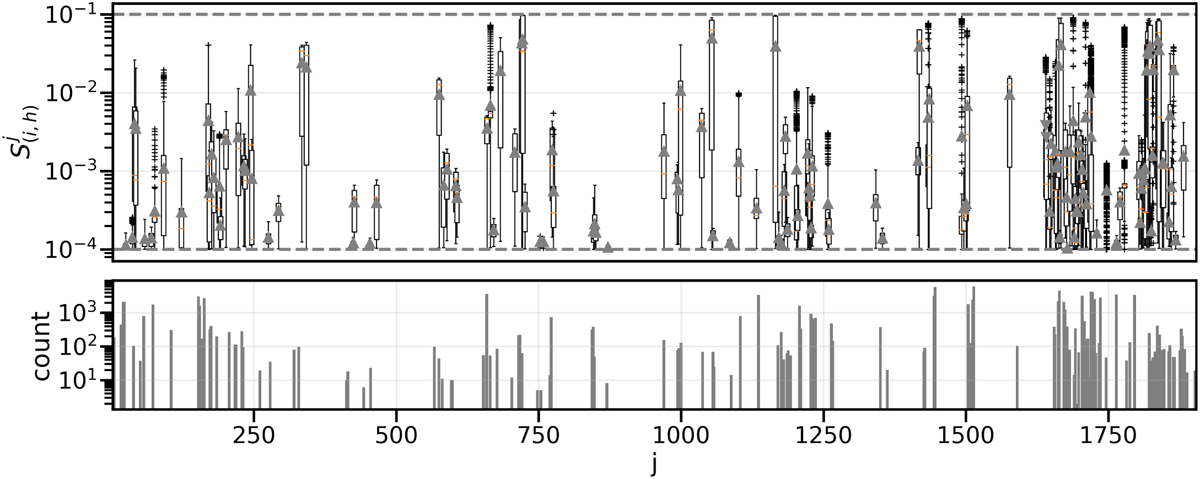
Sensitivity analysis of HD 209458b without photochemistry: Top: Distribution of sensitivities for all molecules at all heights for each reaction ID (j), showing only those above the expected ODE solver noise level. Horizontal lines indicate the noise level and 10 % variation, the maximum expected if the response is linear. Bottom: Count of sensitivities above the noise level for each reaction.
Current usage metrics show cumulative count of Article Views (full-text article views including HTML views, PDF and ePub downloads, according to the available data) and Abstracts Views on Vision4Press platform.
Data correspond to usage on the plateform after 2015. The current usage metrics is available 48-96 hours after online publication and is updated daily on week days.
Initial download of the metrics may take a while.