Fig. 2
Download original image
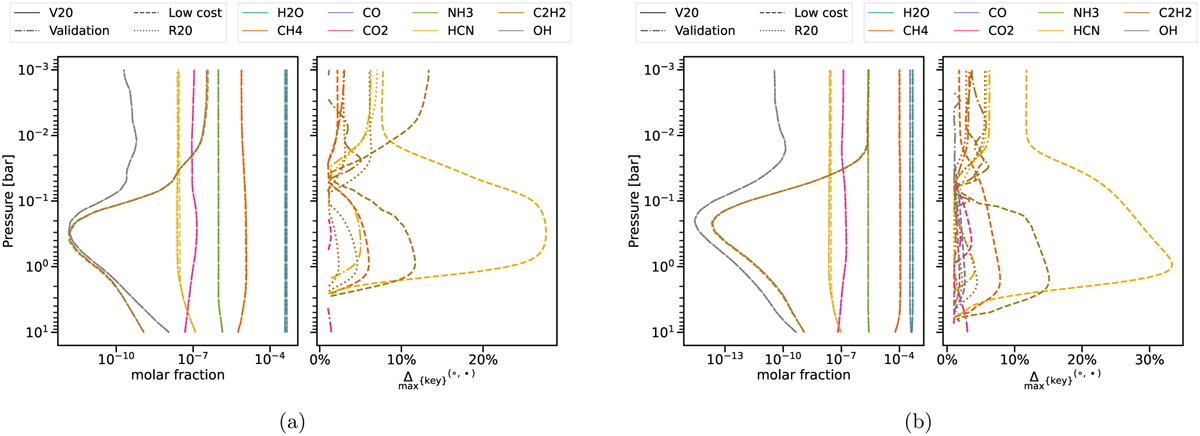
Validation and low-cost schemes’ performance on key and major molecules. The plots illustrate the performance of our method on key molecules for HD 209458b (a) and HD 189733b (b). Left: molar fractions of key molecules as a function of pressure in the atmosphere. The full V20 model is represented by a solid line, DARWEN’s validation scheme by a dashed-dotted line, low-cost schemes by a dashed line, and the reduced scheme (R20) by a dotted line. Right: maximal percentage changes in the molar fractions of the key molecules compared to the full model. The full model’s line is not shown because it serves as the reference model. Lines close to zero indicate that the predictions are nearly identical to those of the full model for that molecule. We only show changes bigger than 1%.
Current usage metrics show cumulative count of Article Views (full-text article views including HTML views, PDF and ePub downloads, according to the available data) and Abstracts Views on Vision4Press platform.
Data correspond to usage on the plateform after 2015. The current usage metrics is available 48-96 hours after online publication and is updated daily on week days.
Initial download of the metrics may take a while.