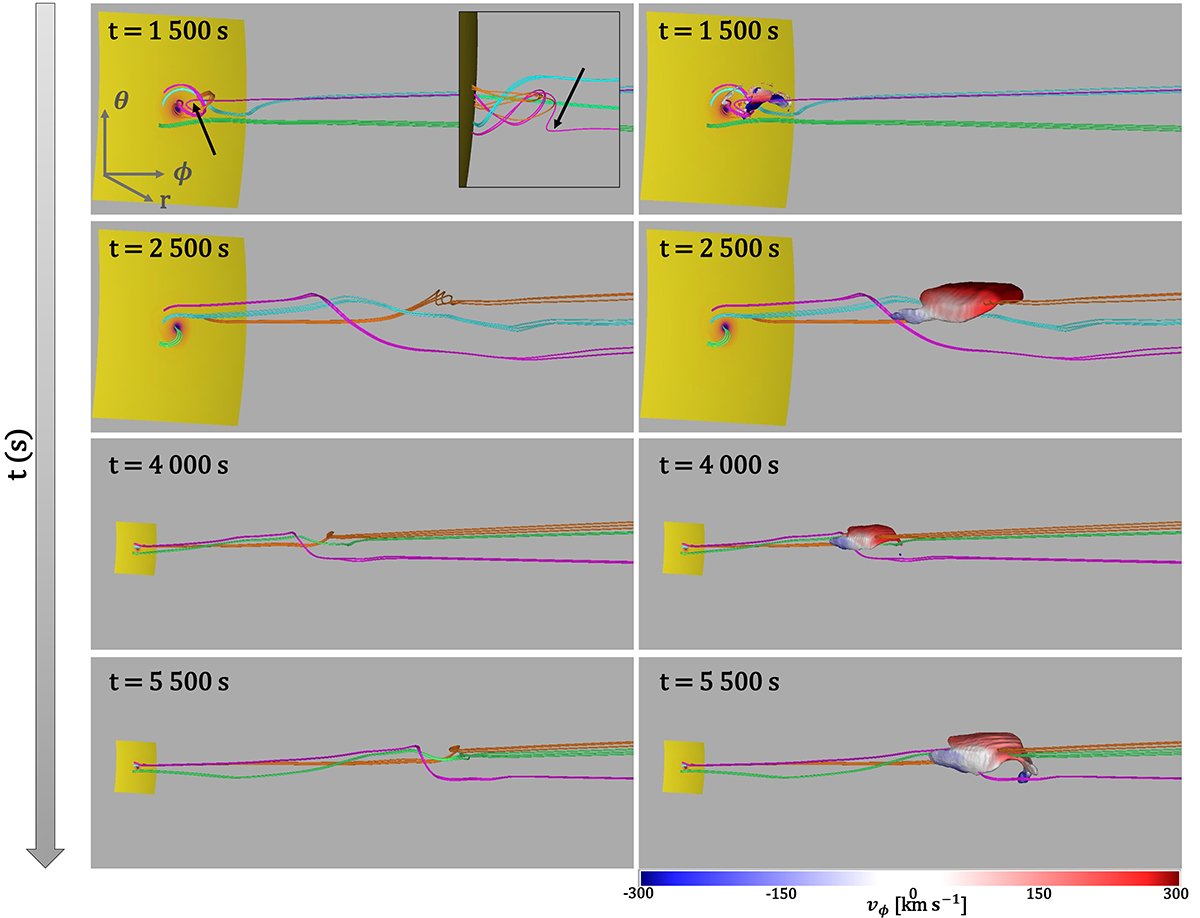
Fig. 8.
Download original image
Snapshots of the evolution of representative magnetic field lines and the high velocity region in Hβ for four different times: 1500 s, 2500 s, 4000 s, and 5500 s. The colour-coded group of magnetic field lines are plotted from fixed points along the bottom boundary from areas where no flow was applied. The bottom boundary corresponding to the solar surface has a size of 18° in both θ and ϕ. In the right column, the isosurface of constant velocity (v = 300 km s−1) is colour-coded according to the ϕ component of the velocity vϕ: blue indicates out-of-plane velocity and red into-plane velocity. Zoomed images are provided for the first two time intervals (1500 s and 2500 s). In the zoomed images, the magnetic fieldlines are visible up to 1.8 R⊙ above the solar surface whereas in the bottom pictures, the magnetic fieldlines are represented up to 4.6 R⊙ above the solar surface. An animation of this figure is available online.
Current usage metrics show cumulative count of Article Views (full-text article views including HTML views, PDF and ePub downloads, according to the available data) and Abstracts Views on Vision4Press platform.
Data correspond to usage on the plateform after 2015. The current usage metrics is available 48-96 hours after online publication and is updated daily on week days.
Initial download of the metrics may take a while.