Fig. 2.
Download original image
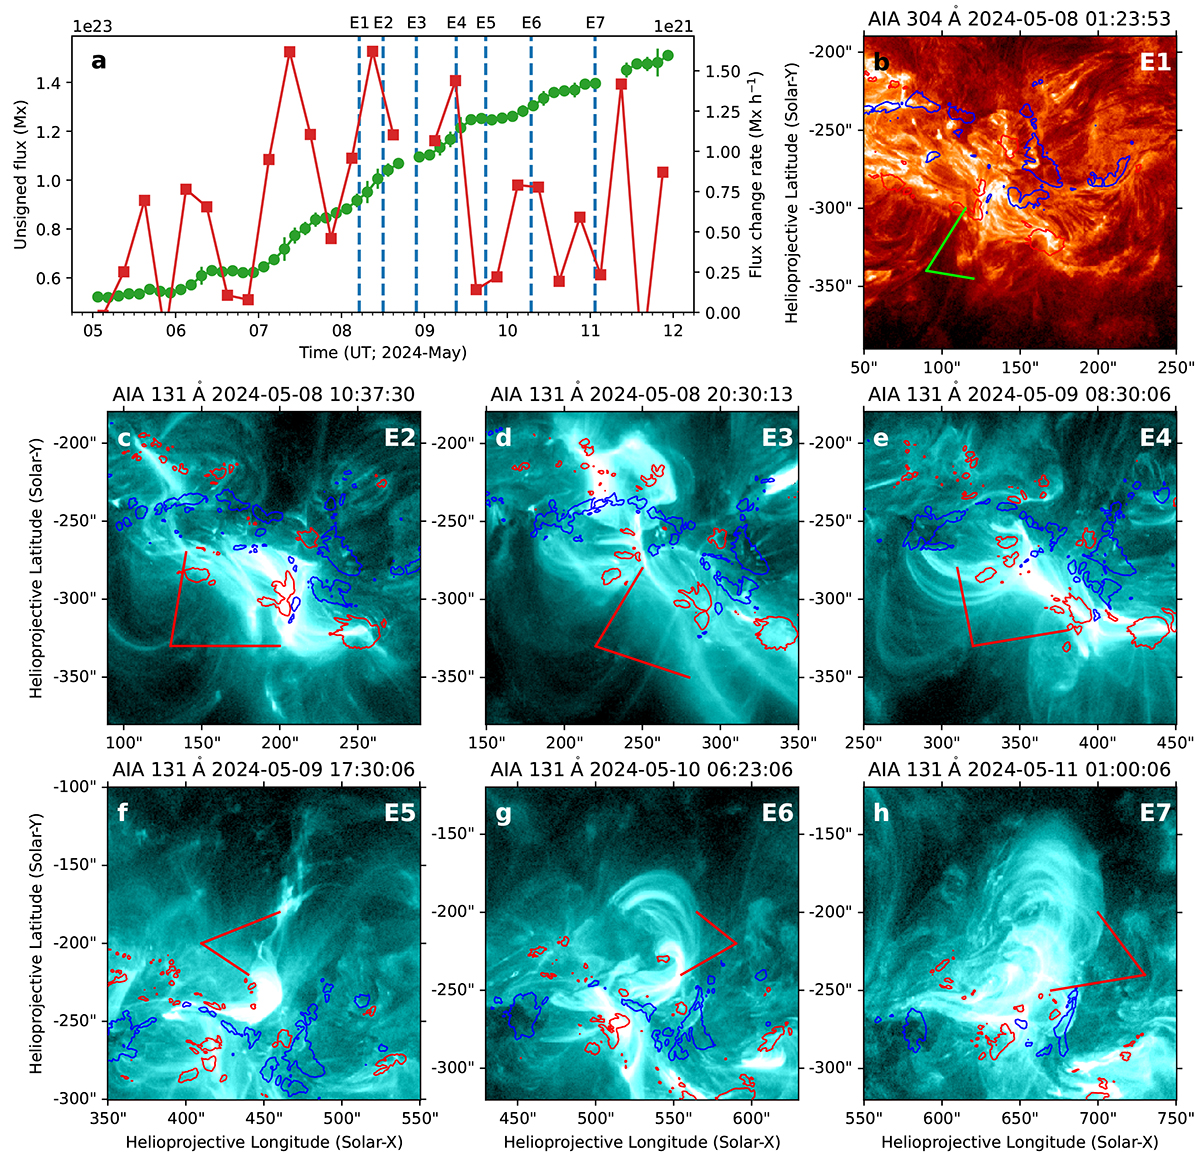
Magnetic flux emergence and CME source regions. (a) Mean unsigned magnetic flux (green, 3-hour windows) and 6-hour average flux emergence rate of AR 13664/8 (red). The error bars are at 3σ within each window. (b)-(h) CME (E1-E7) source regions in AIA 304 Å and 131 Å. The green and red bars point to the locations of filament/hot channel. Positive (blue) and negative (red) fluxes (±1000 G) are overplotted.
Current usage metrics show cumulative count of Article Views (full-text article views including HTML views, PDF and ePub downloads, according to the available data) and Abstracts Views on Vision4Press platform.
Data correspond to usage on the plateform after 2015. The current usage metrics is available 48-96 hours after online publication and is updated daily on week days.
Initial download of the metrics may take a while.