Fig. 7.
Download original image
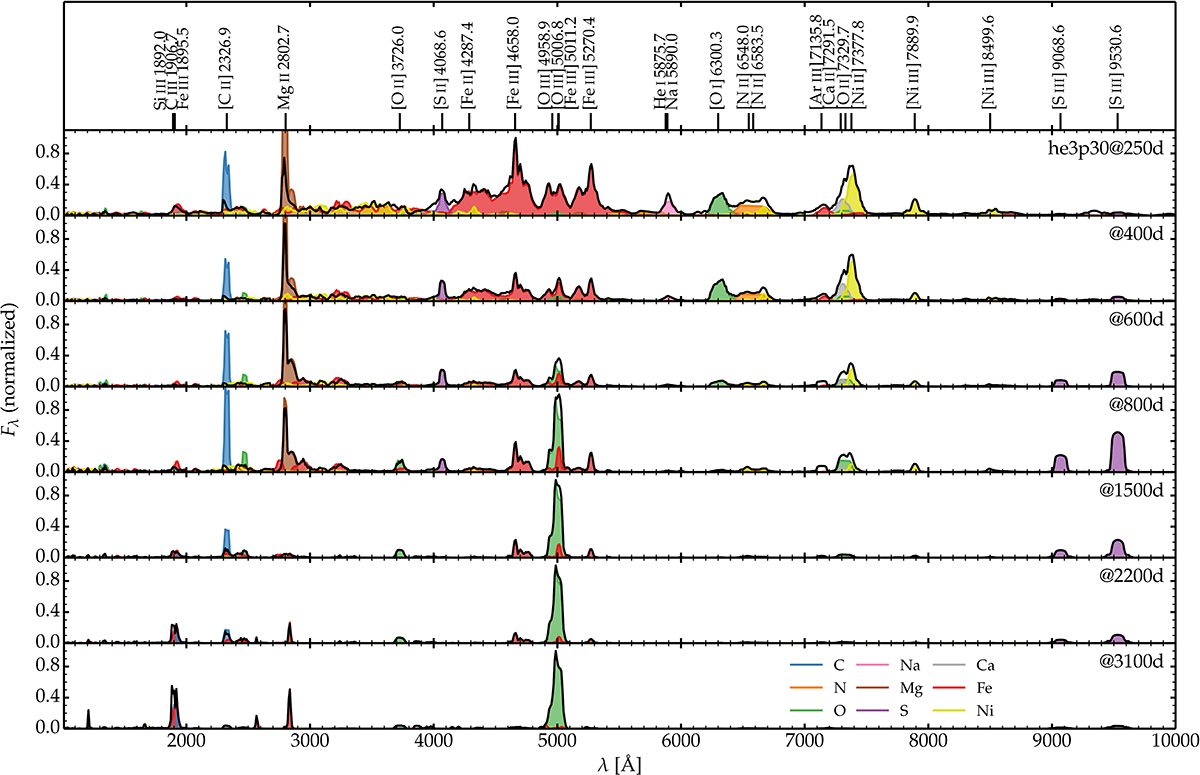
Spectral evolution between 1000 Å and 1 μm and from 250 to 3100 d for model he3p30 under the influence of a constant power of 1039 erg s−1. All spectra are normalized to a maximum flux of unity at each epoch. Contributions by species (e.g., those associated with oxygen include contributions from O I, O II, and O III) are indicated with a colored shading.
Current usage metrics show cumulative count of Article Views (full-text article views including HTML views, PDF and ePub downloads, according to the available data) and Abstracts Views on Vision4Press platform.
Data correspond to usage on the plateform after 2015. The current usage metrics is available 48-96 hours after online publication and is updated daily on week days.
Initial download of the metrics may take a while.