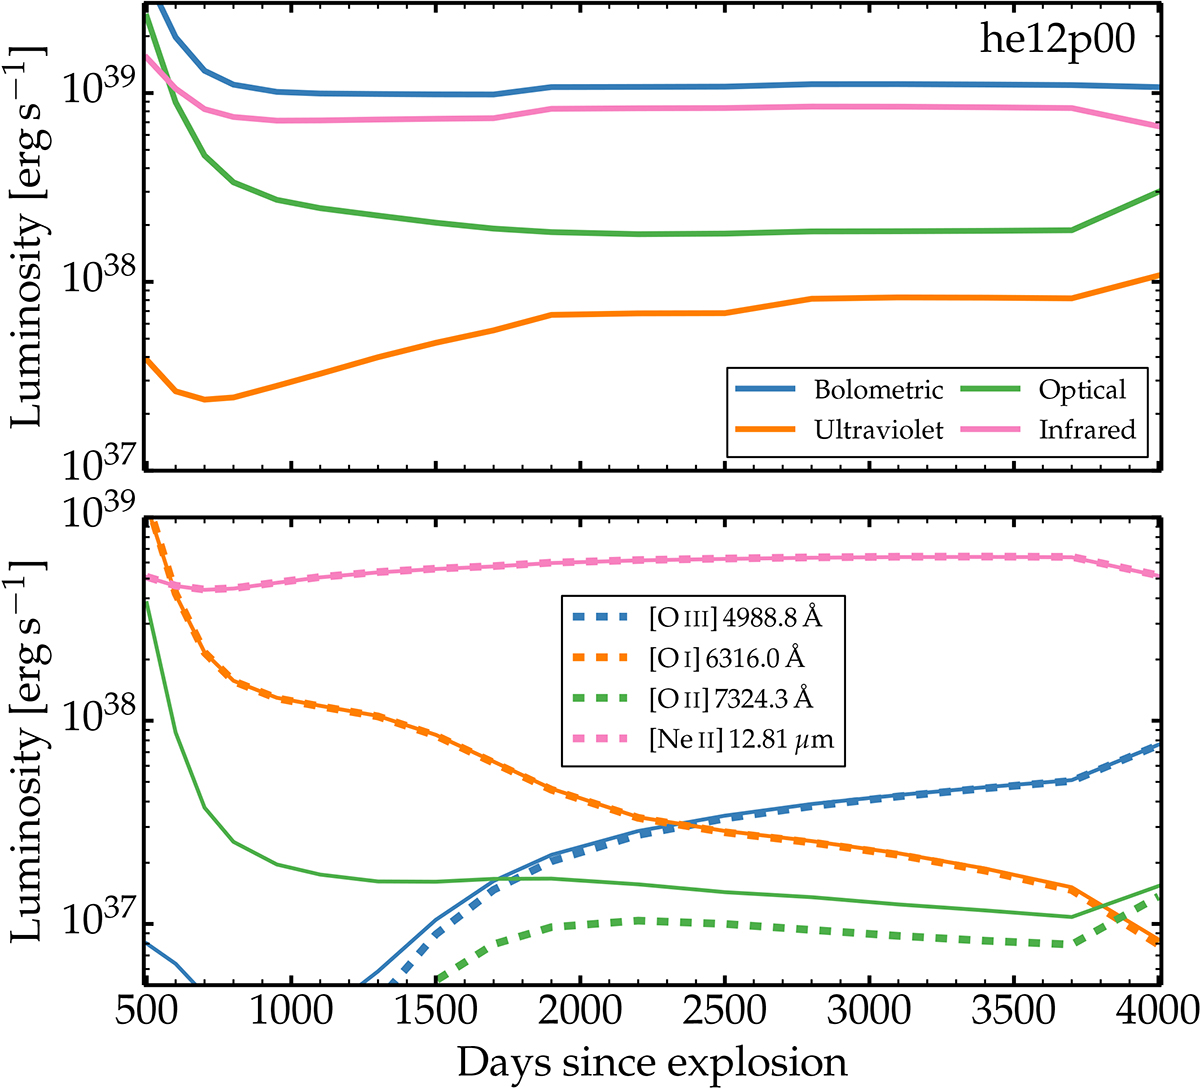
Fig. 5.
Download original image
Evolution of various luminosities in model he12p00 under the influence of a constant magnetar power of 1039 erg s−1. The top panel shows the bolometric, ultraviolet, optical, and infrared luminosities from 500 to 4000 d. The bottom panel shows the luminosity in [O I] λλ6300.3, 6363.8, [O II] λλ7319.5, 7330.2, [O III] λλ4958.9, 5006.8, and [Ne II] 12.81 μm (dashed line) together with the total flux (i.e., including all contributing lines) for the associated emission feature at 6300, 7300, 5000 Å and 12.81 μm (solid line). In most cases, overlapping lines are subdominant (i.e., the dashed and solid lines overlap).
Current usage metrics show cumulative count of Article Views (full-text article views including HTML views, PDF and ePub downloads, according to the available data) and Abstracts Views on Vision4Press platform.
Data correspond to usage on the plateform after 2015. The current usage metrics is available 48-96 hours after online publication and is updated daily on week days.
Initial download of the metrics may take a while.