Fig. 17.
Download original image
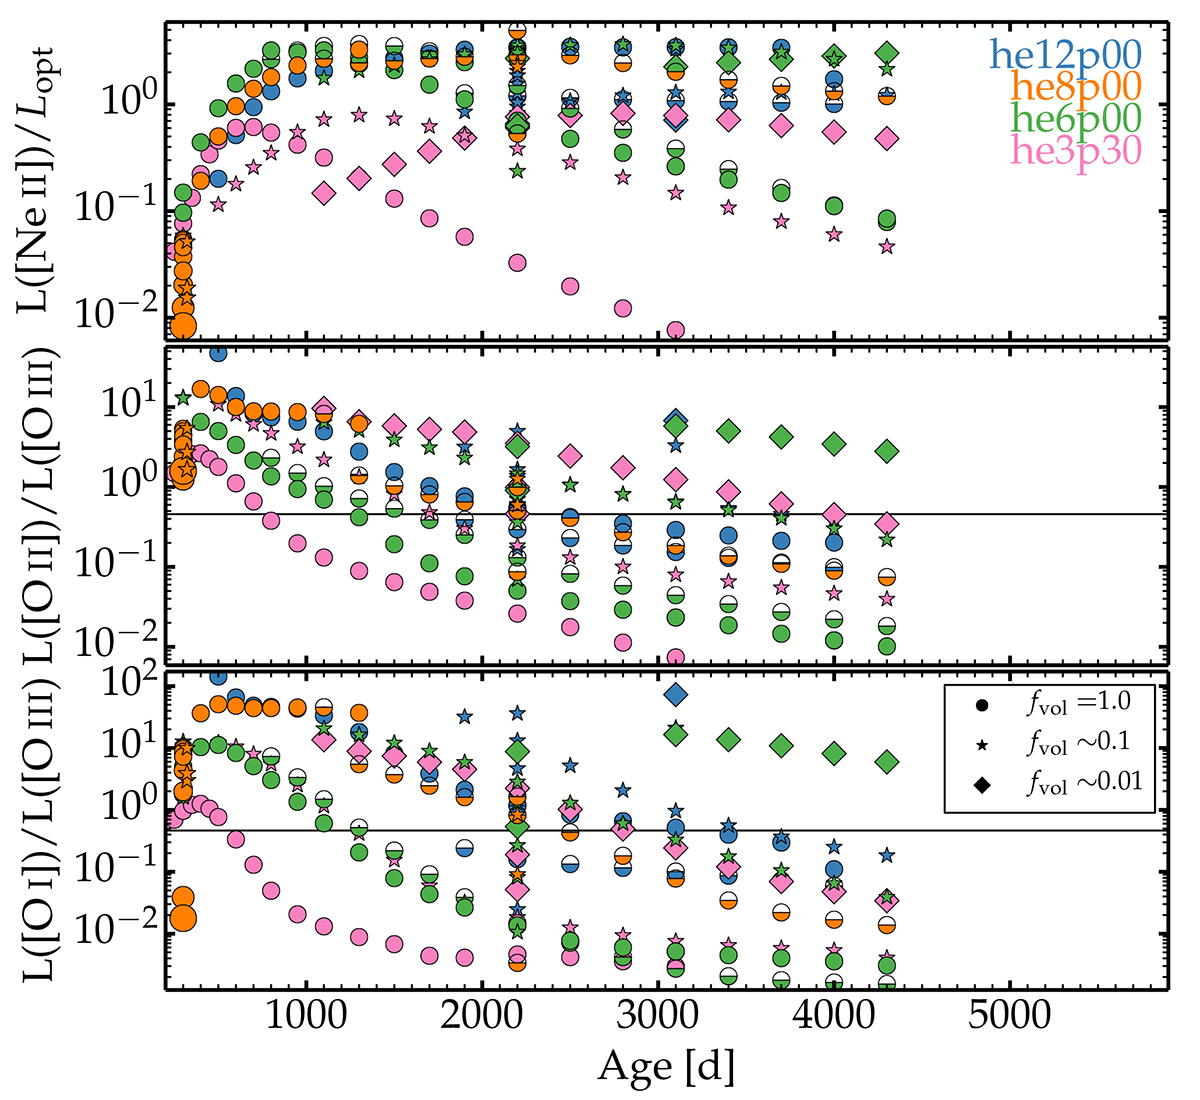
Ratios of various line luminosities for the whole grid of magnetar-powered models as a function of time since explosion. We show the ratio of the [Ne II] 12.81 μm luminosity relative to the optical luminosity (top), the ratio of the [O II] λλ7319.5, 7330.2 and [O III] λλ4958.9, 5006.8 luminosities (middle), and the ratio of the [O I] λλ6300.3, 6363.8 and [O III] λλ4958.9, 5006.8 luminosities (bottom). Different symbols are used to indicate the volume filling factor (i.e., clumping) and a color coding indicates the He-star mass. The horizontal black line corresponds to the observed counterparts for SN 2012au at 2269 d (Milisavljevic et al. 2018).
Current usage metrics show cumulative count of Article Views (full-text article views including HTML views, PDF and ePub downloads, according to the available data) and Abstracts Views on Vision4Press platform.
Data correspond to usage on the plateform after 2015. The current usage metrics is available 48-96 hours after online publication and is updated daily on week days.
Initial download of the metrics may take a while.