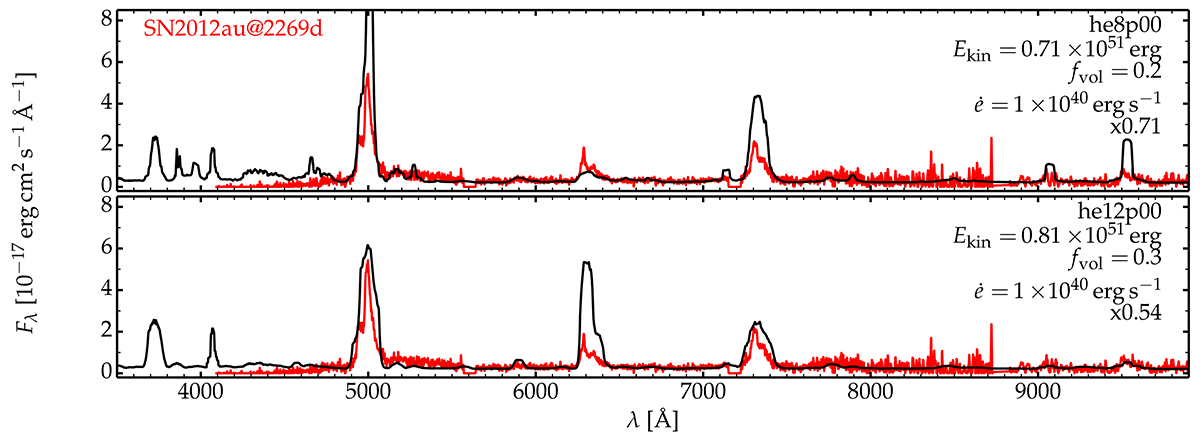
Fig. 16.
Download original image
Same as for Fig. 14, but now for the observations of SN 2012au at 2269 d and using the he8p00 or he12p00 models with a magnetar power of 1040 erg s−1 and different levels of clumping. In each case, the model is scaled to match the same optical luminosity as inferred from observations. We also shift both models up by 2 × 10⁻¹⁸erg s−1 cm−2 Å to match the observed flux present between the emission lines in SN 2012au (the model predicts zero flux in those regions). [See Section 10.3 for discussion.]
Current usage metrics show cumulative count of Article Views (full-text article views including HTML views, PDF and ePub downloads, according to the available data) and Abstracts Views on Vision4Press platform.
Data correspond to usage on the plateform after 2015. The current usage metrics is available 48-96 hours after online publication and is updated daily on week days.
Initial download of the metrics may take a while.