Open Access
Fig. A.2
Download original image
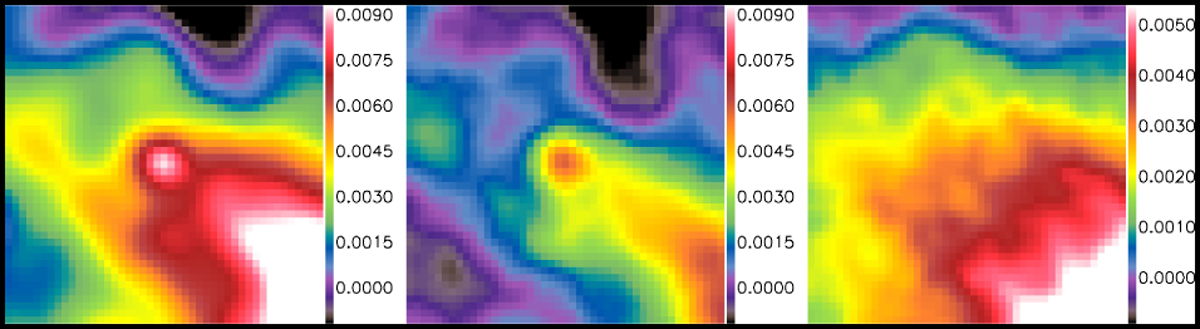
Simulation of the effect of the 2 mm noise on the data: zoom on the input 160-μm map (left), on the simulation output (middle) and on the difference between the two maps, with a smaller dynamic range (right). The pixel size and FWHM resolution are the same as in Fig. A.1 and the flux unit is Jy/pixel.
Current usage metrics show cumulative count of Article Views (full-text article views including HTML views, PDF and ePub downloads, according to the available data) and Abstracts Views on Vision4Press platform.
Data correspond to usage on the plateform after 2015. The current usage metrics is available 48-96 hours after online publication and is updated daily on week days.
Initial download of the metrics may take a while.