Fig. 1
Download original image
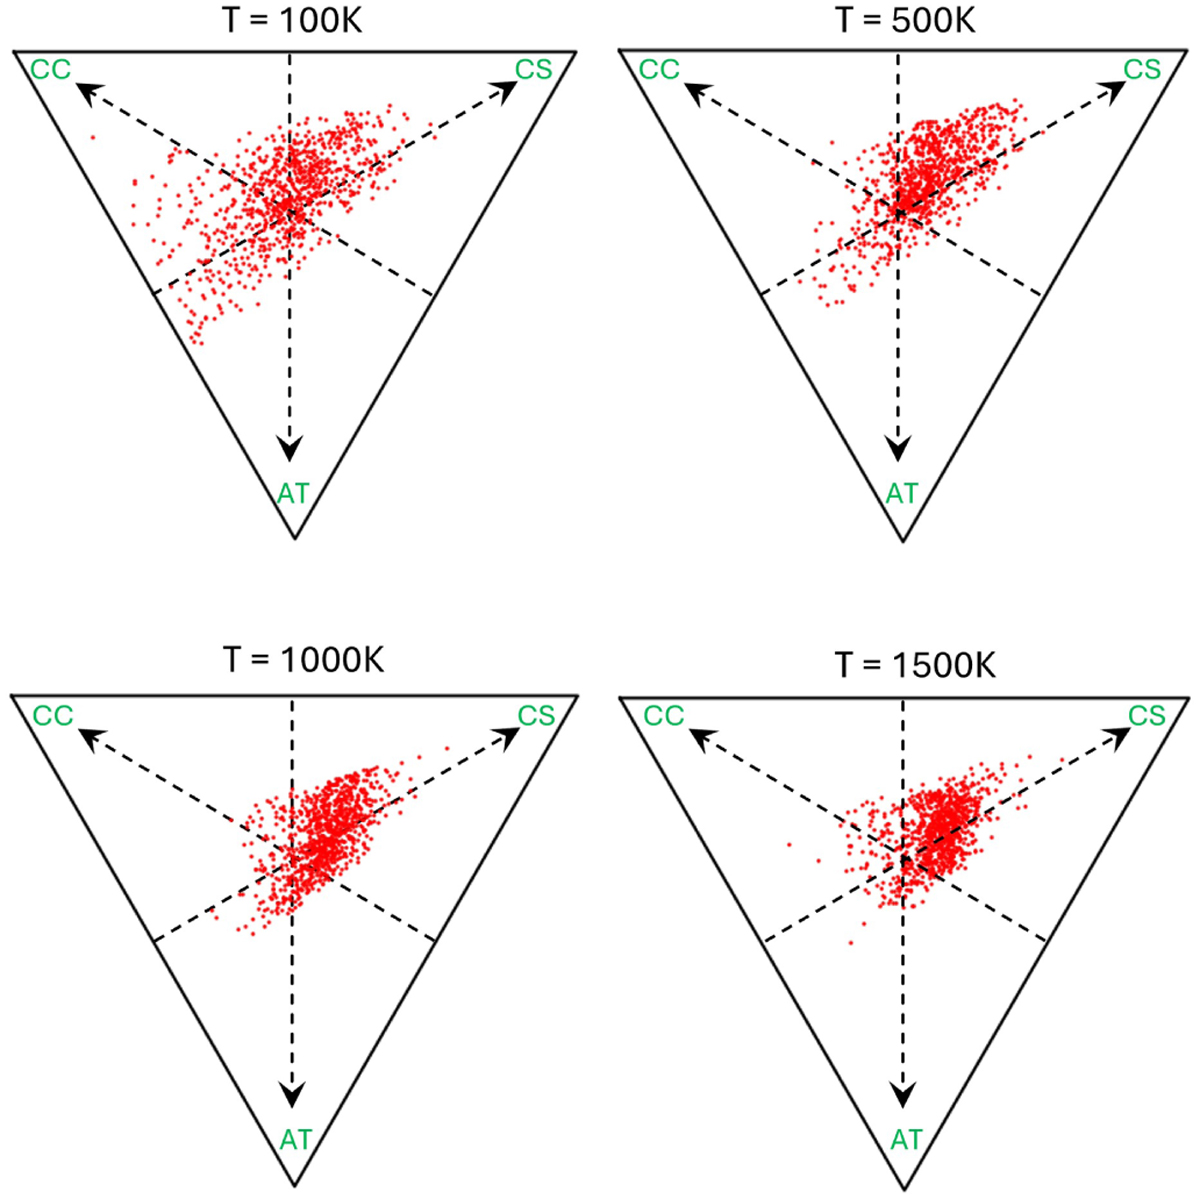
Dalitz plots for the comparison of 990 state-to-state transition rate coefficients for para-H2O + para-H2 collisions at four different temperatures: 100, 500, 1000, and 1500 K. Each triangular plot represents a comparison between three computational methods: MQCT from this work (AT), full quantum (CC) calculations (Daniel et al. 2011), and full quantum (CS) calculations (Zóltowski et al. 2021) using MOLSCAT. Different red dots within each triangle represent different transitions.
Current usage metrics show cumulative count of Article Views (full-text article views including HTML views, PDF and ePub downloads, according to the available data) and Abstracts Views on Vision4Press platform.
Data correspond to usage on the plateform after 2015. The current usage metrics is available 48-96 hours after online publication and is updated daily on week days.
Initial download of the metrics may take a while.