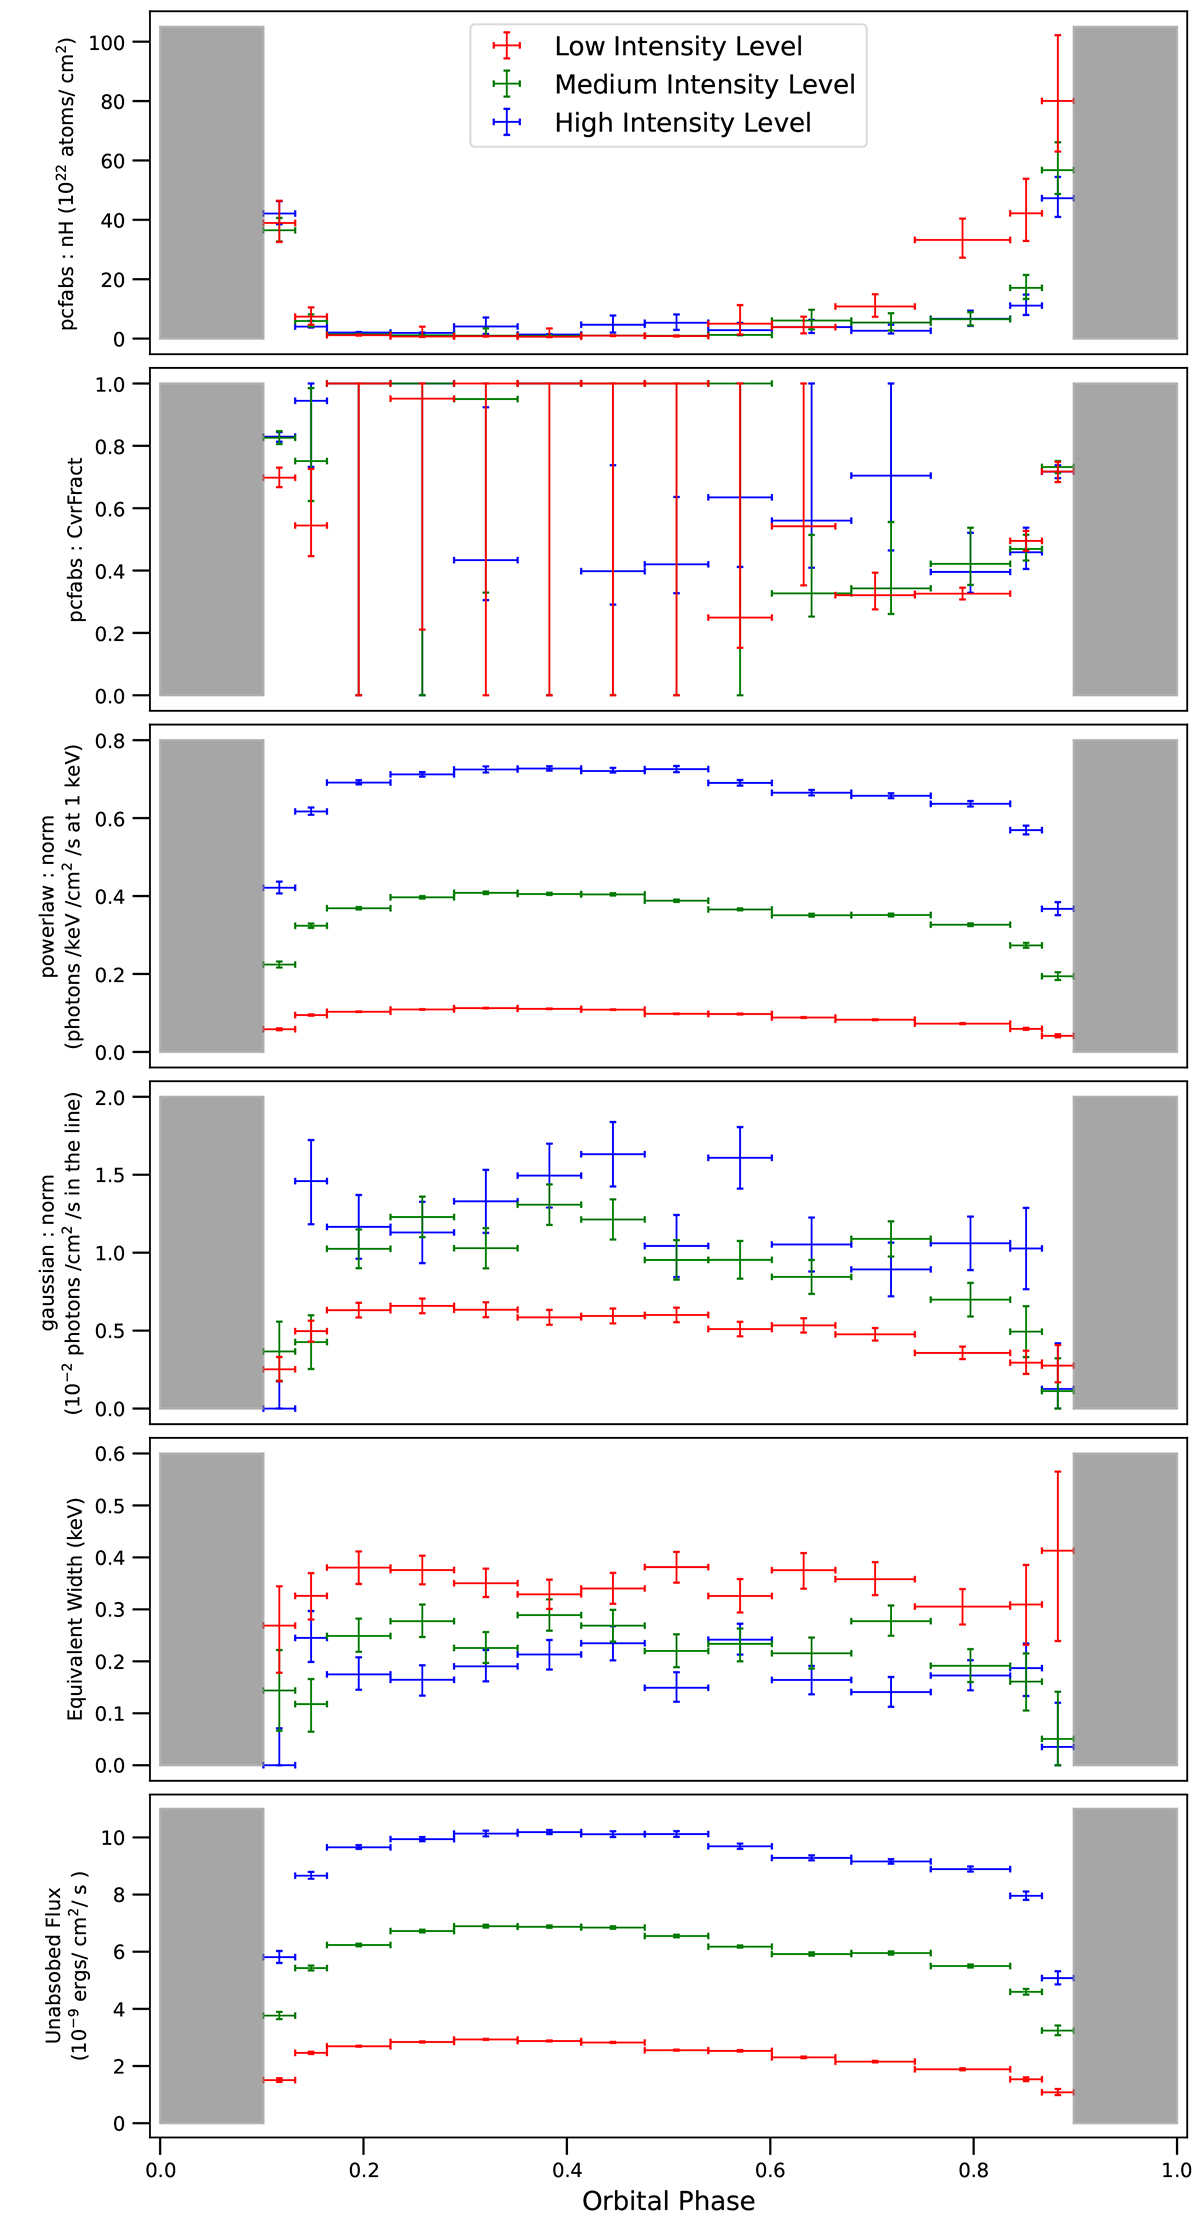
Fig. 9.
Download original image
Intensity-resolved and orbital-phase-resolved spectroscopy for all three intensity levels plotted in red, green, and blue, respectively. The 2−20 keV unabsorbed flux for the spectral model used is calculated and plotted at the bottom. The errors are quoted at a 1σ confidence level. The shaded region indicates the eclipse phase of Cen X-3.
Current usage metrics show cumulative count of Article Views (full-text article views including HTML views, PDF and ePub downloads, according to the available data) and Abstracts Views on Vision4Press platform.
Data correspond to usage on the plateform after 2015. The current usage metrics is available 48-96 hours after online publication and is updated daily on week days.
Initial download of the metrics may take a while.