Fig. 8.
Download original image
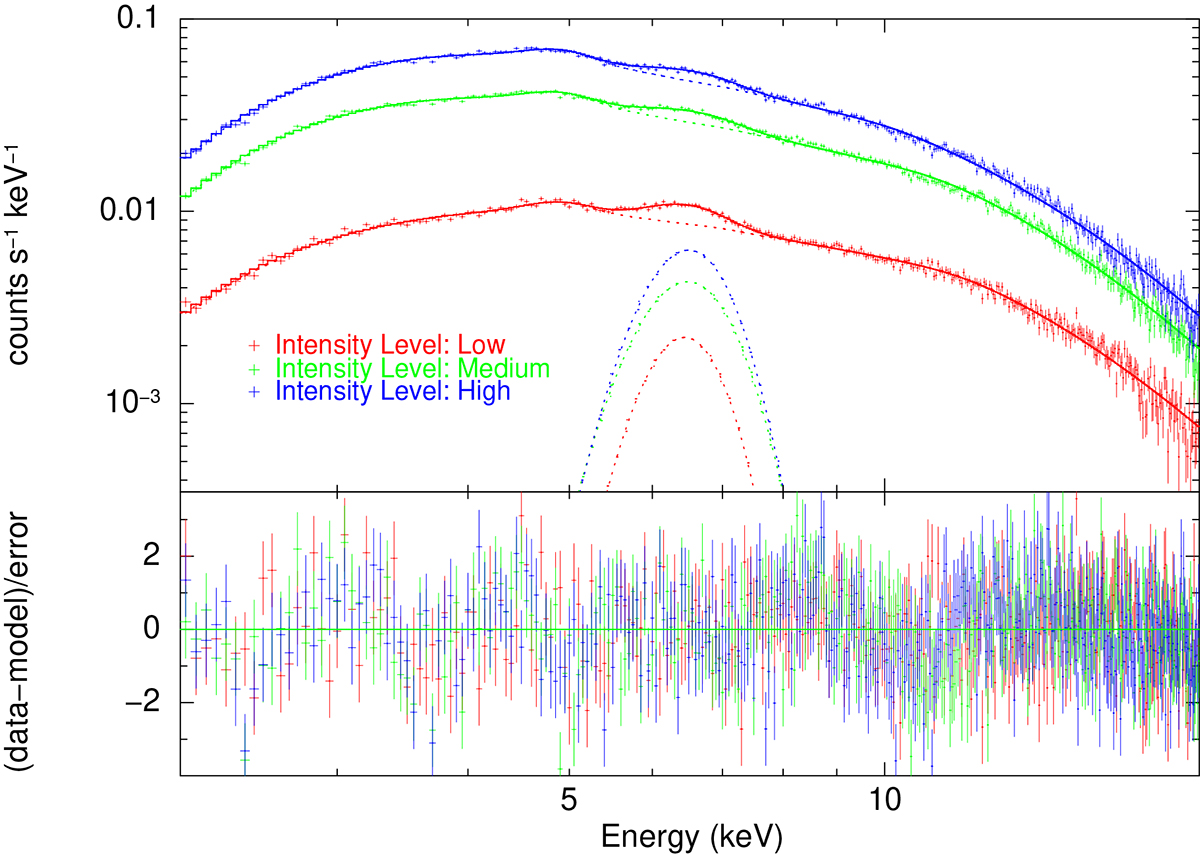
Intensity-resolved and orbital-phase-averaged 2−20 keV spectrum of Cen X-3 for the ∼13.5 years of MAXI/GSC data. Top panel: 2−20 keV MAXI/GSC orbital-phase-averaged spectrum for all three intensity levels of Cen X-3 with their best-fit spectral model. Bottom panel: Residual of the best-fit spectral model for all intensity levels.
Current usage metrics show cumulative count of Article Views (full-text article views including HTML views, PDF and ePub downloads, according to the available data) and Abstracts Views on Vision4Press platform.
Data correspond to usage on the plateform after 2015. The current usage metrics is available 48-96 hours after online publication and is updated daily on week days.
Initial download of the metrics may take a while.