Open Access
Fig. 8
Download original image
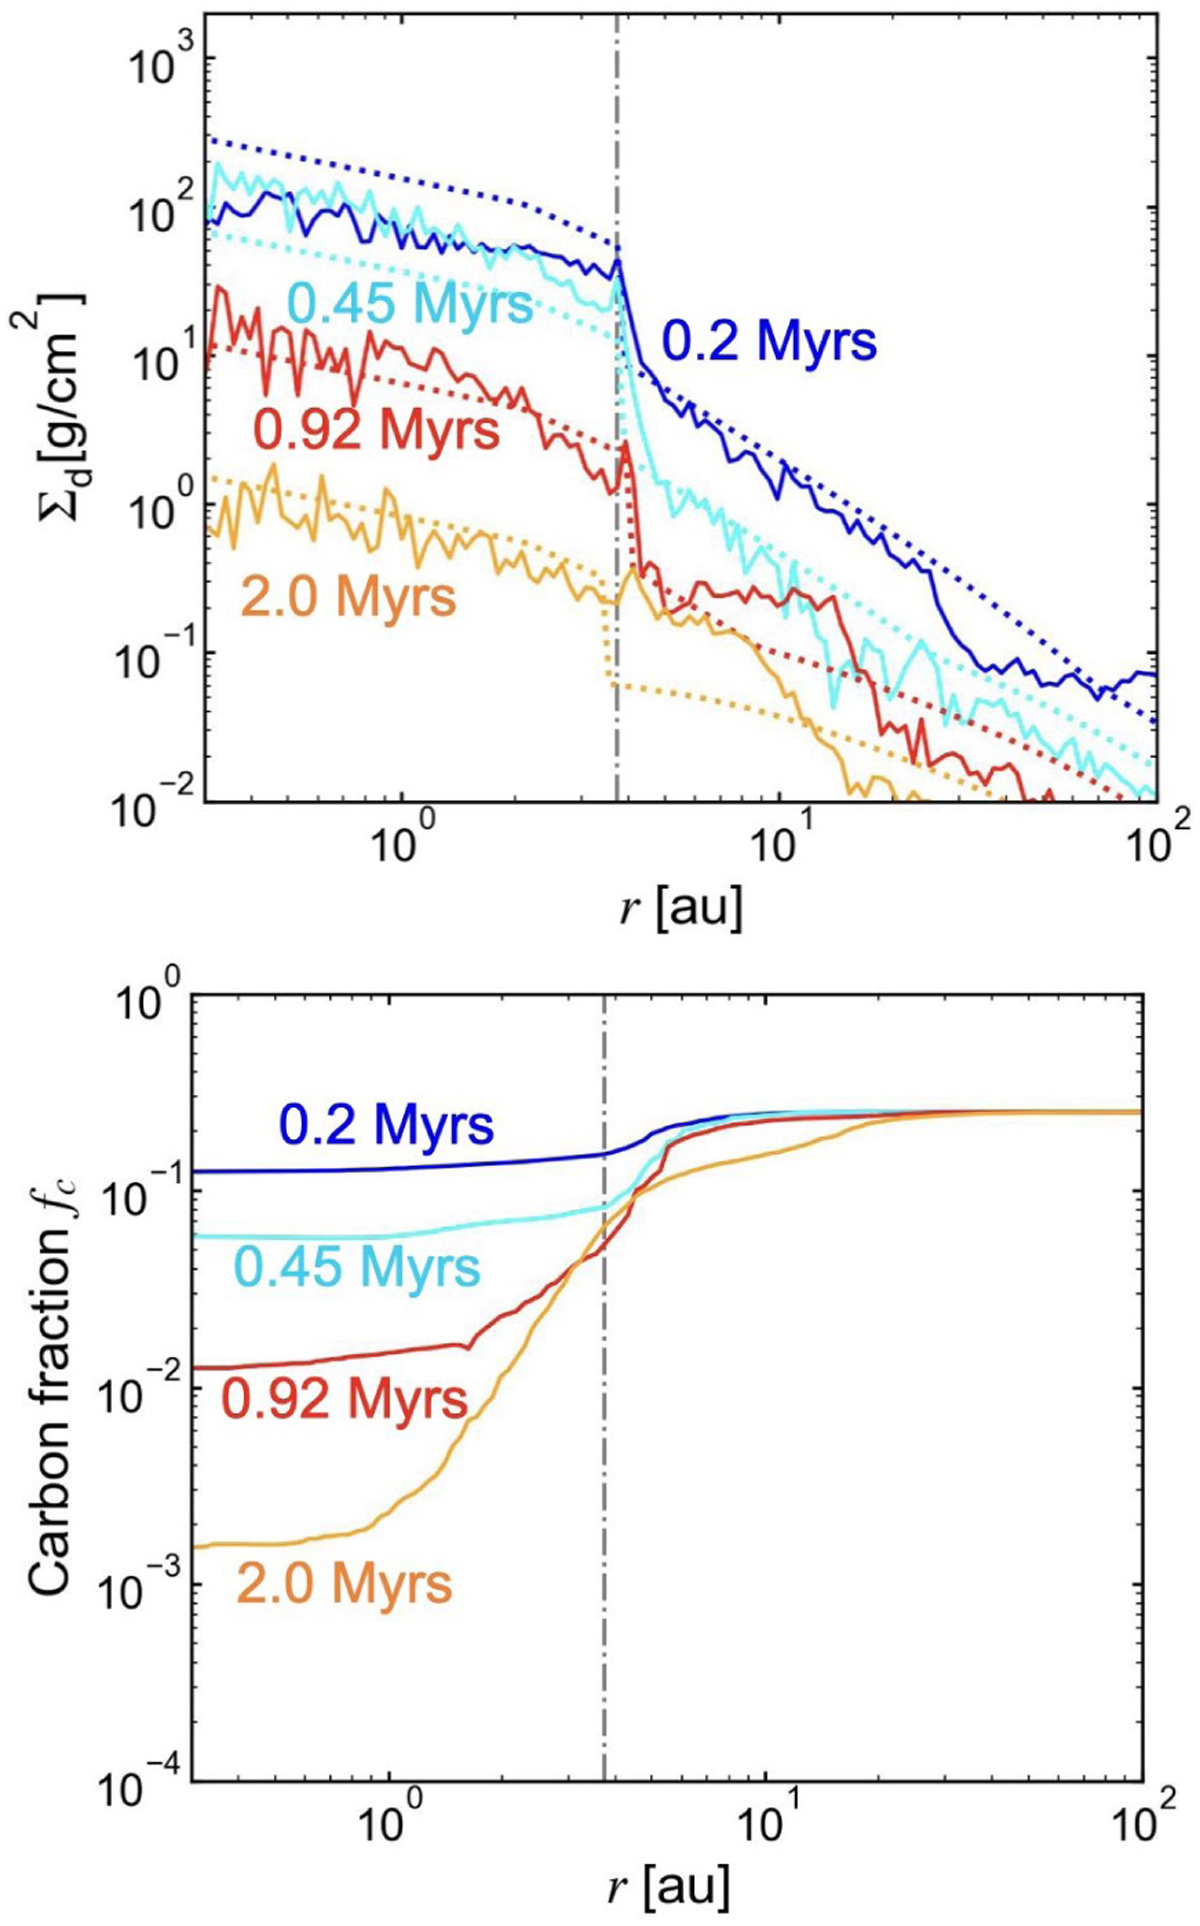
Time evolution of the solid surface density ∑d (upper panel) and the carbon fraction, fc, (lower panel) of the fiducial run. The gray dash-dotted line shows the snow line. The dotted lines in the upper panel show the analytical estimations given by Eq. (68). The dash-dotted lines represent the snow line at rsnow ~ 3.7 au.
Current usage metrics show cumulative count of Article Views (full-text article views including HTML views, PDF and ePub downloads, according to the available data) and Abstracts Views on Vision4Press platform.
Data correspond to usage on the plateform after 2015. The current usage metrics is available 48-96 hours after online publication and is updated daily on week days.
Initial download of the metrics may take a while.