Fig. 7
Download original image
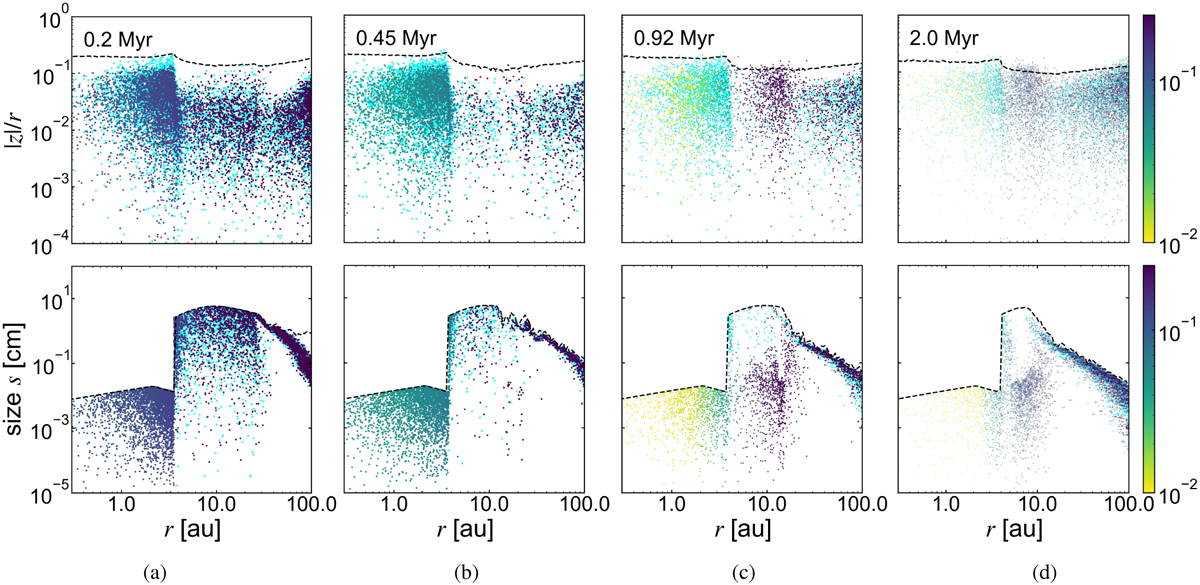
Snapshots of solid super-particles in the r-(|z|/r) plane and size distribution. The upper panels show the snapshots of silicates at (a) 0.2 Myr (~tpf), (b) 0.45 Myr (~tpf + tdrift,ice), (c) 0.92 Myr(~tpf + tdrift,ice + tdiff,snow), and (d) 2.0 Myr. The color bar shows the carbon fraction of each silicate super-particle. The cyan dots show the icy super-particles. The black dashed line shows the height of τFUV = 1. The lower panels show the size distributions of silicates corresponding to the upper panels. The black dashed line shows the local maximum dust size (smax) (Eq. (31)).
Current usage metrics show cumulative count of Article Views (full-text article views including HTML views, PDF and ePub downloads, according to the available data) and Abstracts Views on Vision4Press platform.
Data correspond to usage on the plateform after 2015. The current usage metrics is available 48-96 hours after online publication and is updated daily on week days.
Initial download of the metrics may take a while.