Open Access
Fig. C.1
Download original image
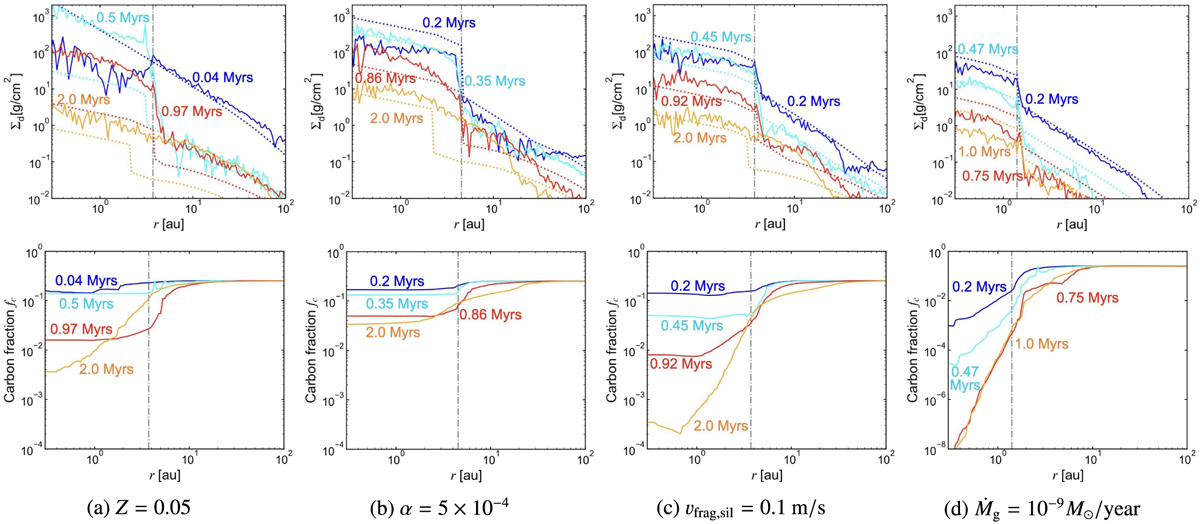
Time evolution of the solid surface densities (top row) and carbon fractions (bottom row) for each parameter set. The sub-captions show the parameter which we changed from the fiducial parameter set. The dashed lines in the top row show the analytic estimation given by Eq. 68.
Current usage metrics show cumulative count of Article Views (full-text article views including HTML views, PDF and ePub downloads, according to the available data) and Abstracts Views on Vision4Press platform.
Data correspond to usage on the plateform after 2015. The current usage metrics is available 48-96 hours after online publication and is updated daily on week days.
Initial download of the metrics may take a while.