Fig. 14
Download original image
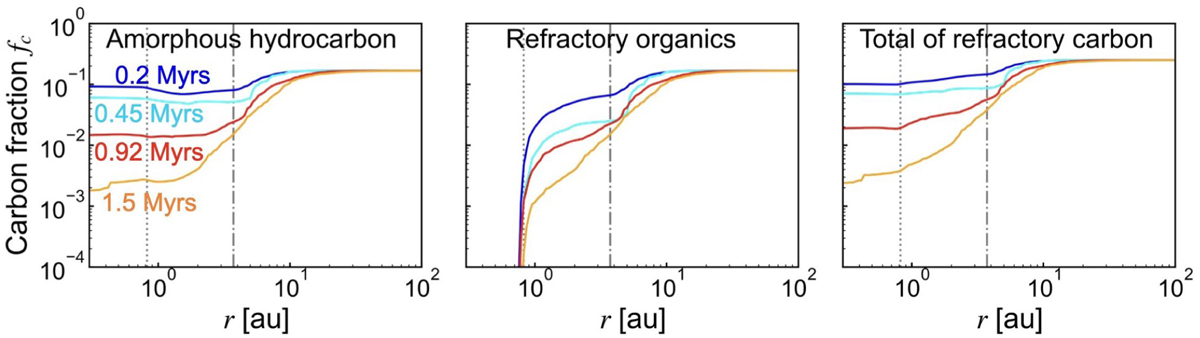
Carbon fraction, fc, with a mixture of complex organics with Tdes = 540 K (50 wt.%) and amorphous hydrocarbons (50 wt.%). The left figure shows the mass fraction of amorphous hydrocarbons, the middle panel shows that of complex organics, and the right panel shows the total carbon fraction. The gray dash-dotted and dotted lines snow the snow and pyrolysis lines.
Current usage metrics show cumulative count of Article Views (full-text article views including HTML views, PDF and ePub downloads, according to the available data) and Abstracts Views on Vision4Press platform.
Data correspond to usage on the plateform after 2015. The current usage metrics is available 48-96 hours after online publication and is updated daily on week days.
Initial download of the metrics may take a while.