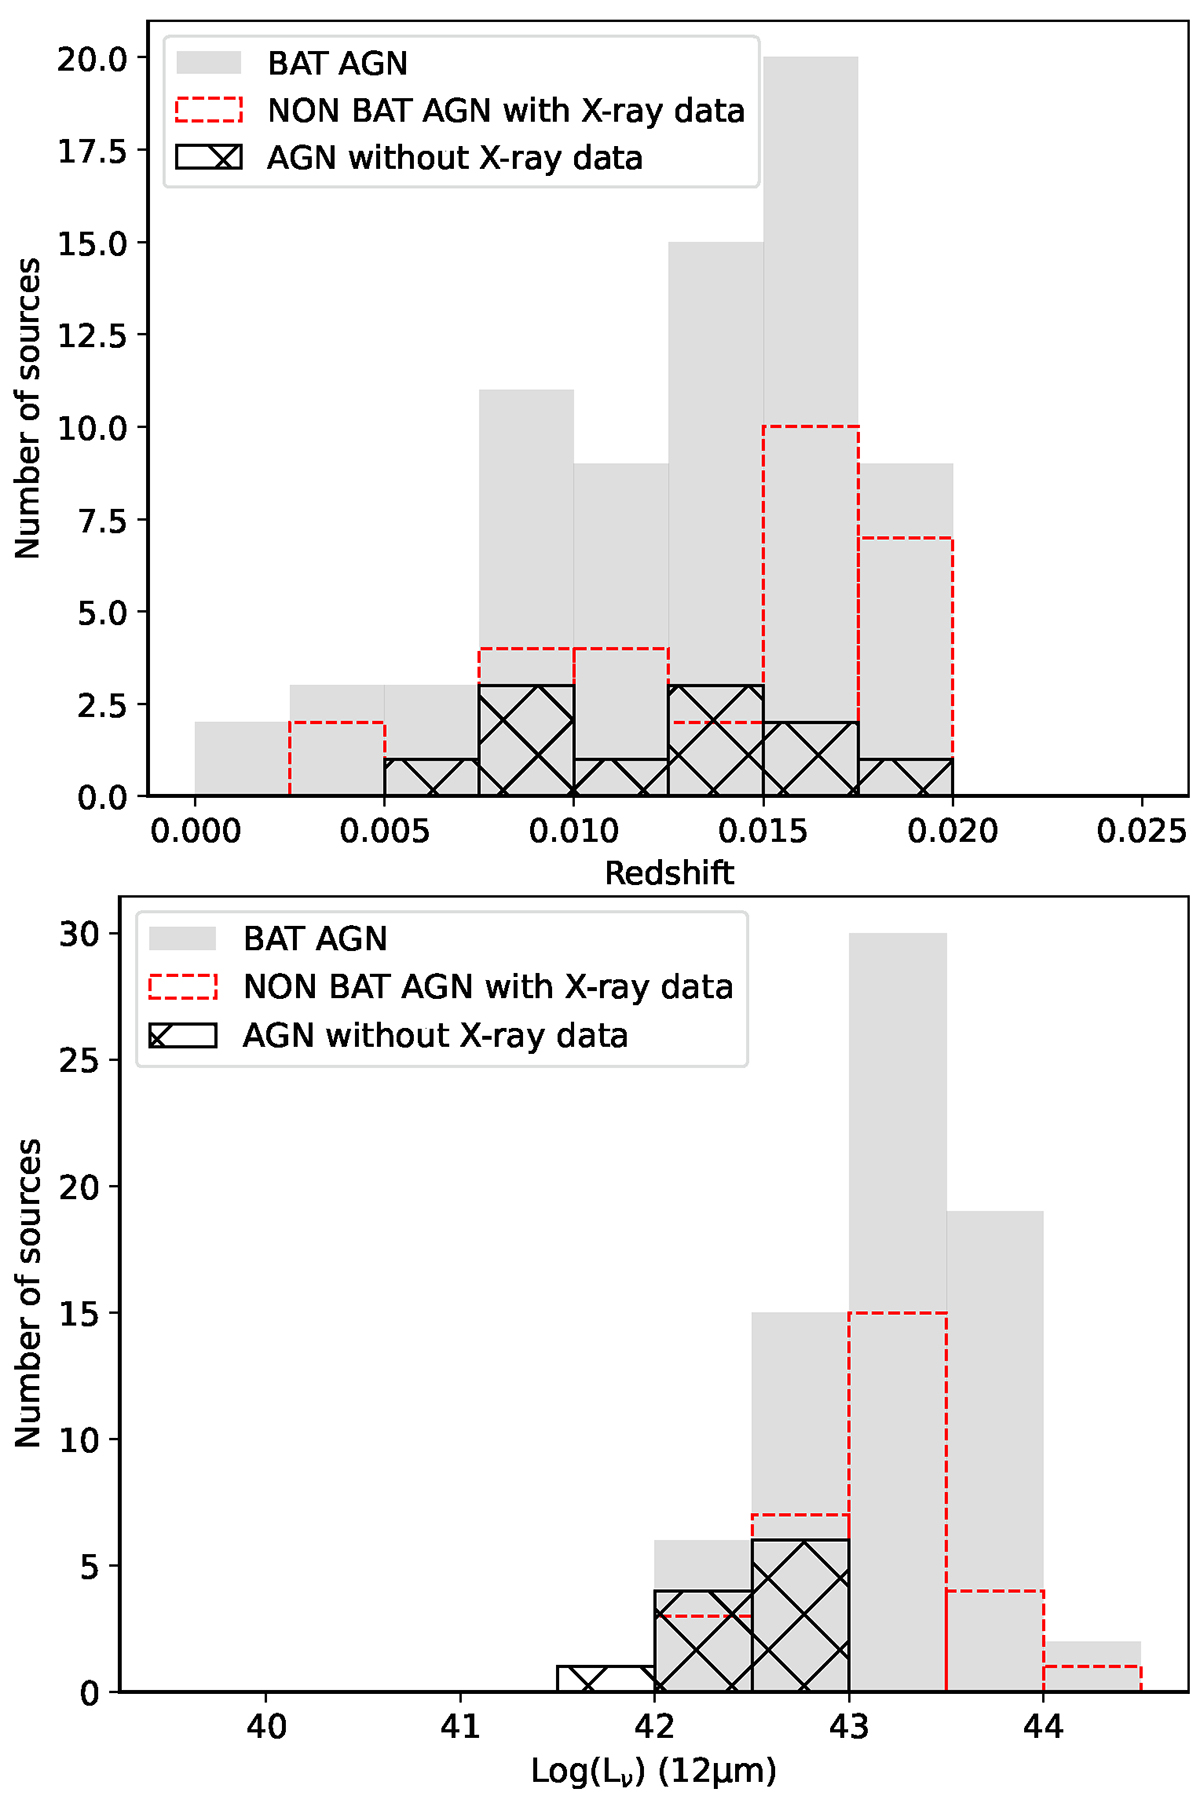
Fig. 6.
Download original image
The redshift and luminosity distributions for the sources in our sample. (a) Upper panel: Comparison of the redshift distribution for the sources in our sample according to their origin. Sources found in BAT surveys are shown with gray histogram, sources with X-ray data missed by BAT survey are displayed with red-dashed line and sources without X-ray data are shown with the hatched histogram. (b) Lower panel: Similar as above for the L12 μm luminosity obtained from Asmus et al. (2020).
Current usage metrics show cumulative count of Article Views (full-text article views including HTML views, PDF and ePub downloads, according to the available data) and Abstracts Views on Vision4Press platform.
Data correspond to usage on the plateform after 2015. The current usage metrics is available 48-96 hours after online publication and is updated daily on week days.
Initial download of the metrics may take a while.