Fig. 8
Download original image
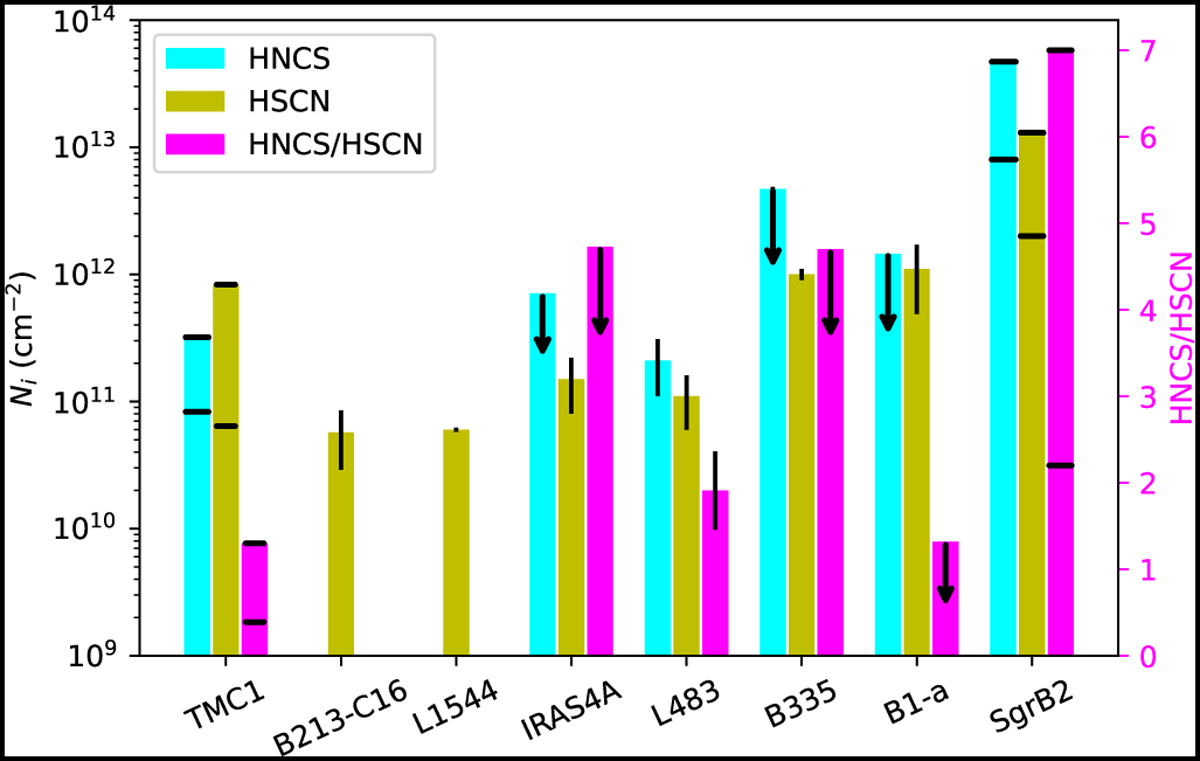
HNCS and HSCN column densities (left Y-axis) and HNCS/HSCN ratio (right Y-axis) for different objects: starless/prestellar cores (TMC-1, L 1544, B 213-C16), Class 0 (IRAS 4A, L 483, B 335), Class I (B1-a), and a high-mass star forming region (Sgr B2). Black arrows indicate upper limits (B 335 and B1-a). For TMC-1 and Sgr B2, the observed column density ranges are indicated with horizontal lines. References to these data are included in Table 3.
Current usage metrics show cumulative count of Article Views (full-text article views including HTML views, PDF and ePub downloads, according to the available data) and Abstracts Views on Vision4Press platform.
Data correspond to usage on the plateform after 2015. The current usage metrics is available 48-96 hours after online publication and is updated daily on week days.
Initial download of the metrics may take a while.