Open Access
Fig. 8.
Download original image
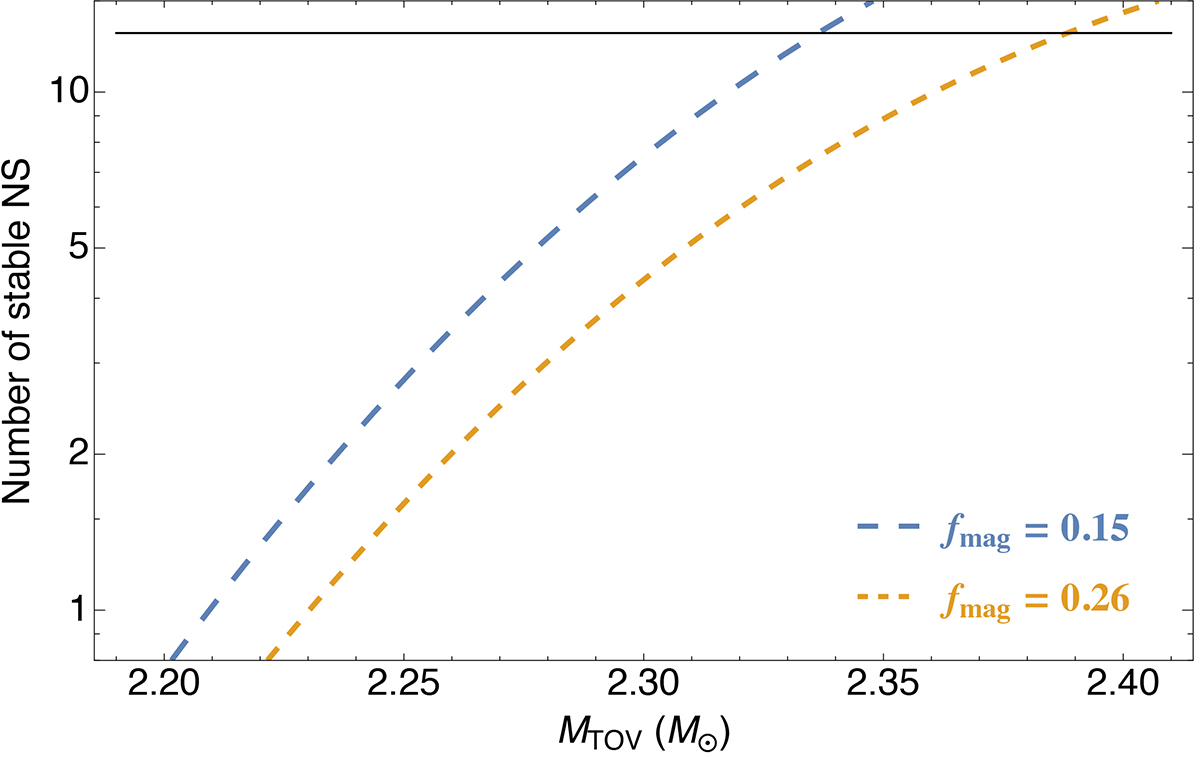
Number of stable or long-lived NSs in our sample as a function of MTOV. The two dashed curves correspond to the minimum and maximum fractions found in this work. The upper, horizontal black curve indicates the total of 13 NSs.
Current usage metrics show cumulative count of Article Views (full-text article views including HTML views, PDF and ePub downloads, according to the available data) and Abstracts Views on Vision4Press platform.
Data correspond to usage on the plateform after 2015. The current usage metrics is available 48-96 hours after online publication and is updated daily on week days.
Initial download of the metrics may take a while.