Fig. 4.
Download original image
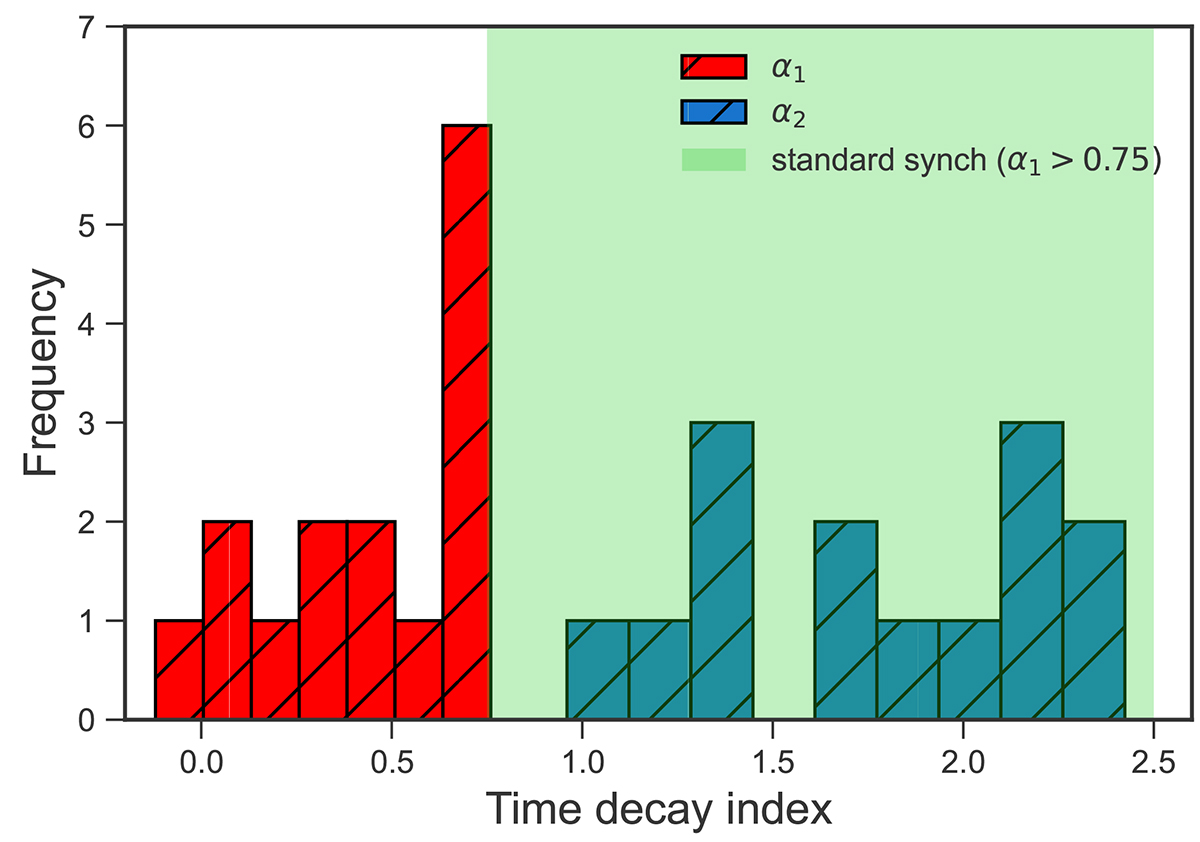
Power-law decay indices before (α1, in red) and after the break (α2, in blue) for the BPL subsample (see Sect. 3.2). The green shaded area highlights the region that can be explained with the standard afterglow model (assuming the slow-cooling regime and a constant circumburst medium; e.g. Sari et al. 1998), that is 0.75 < α1 < 2.5. All the values we find for α1 cannot be explained with this model, suggesting the need for an alternative interpretation (see Sect. 3.3 for further details).
Current usage metrics show cumulative count of Article Views (full-text article views including HTML views, PDF and ePub downloads, according to the available data) and Abstracts Views on Vision4Press platform.
Data correspond to usage on the plateform after 2015. The current usage metrics is available 48-96 hours after online publication and is updated daily on week days.
Initial download of the metrics may take a while.