Fig. 3.
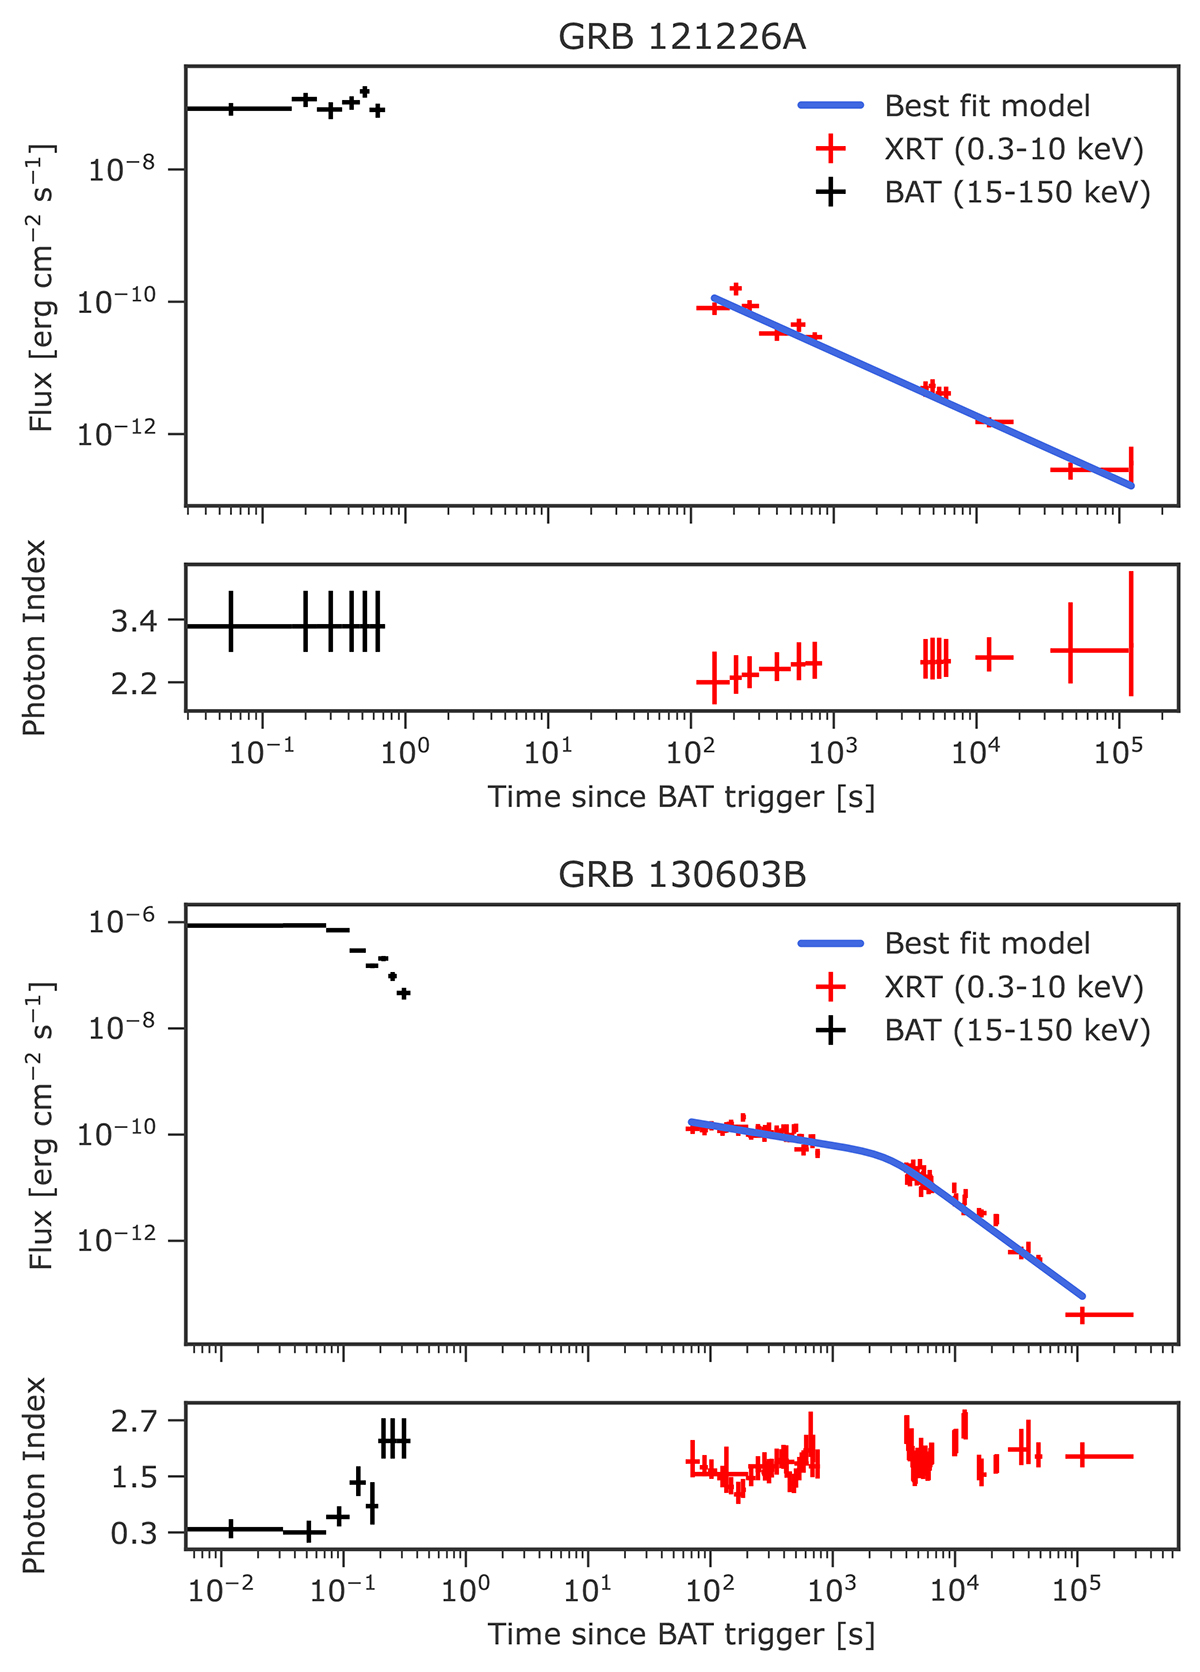
Download original image
Swift XRT (red) and BAT (black) light curves of two representative GRBs from the LC fit sample. Upper panel: Example of a SGRB for which the fit with the simple power-law model (blue line) accurately reproduces the light curve behaviour. Lower panel: Example of a SGRB for which the broken power-law model (blue line) provides a more statistically significant fit.
Current usage metrics show cumulative count of Article Views (full-text article views including HTML views, PDF and ePub downloads, according to the available data) and Abstracts Views on Vision4Press platform.
Data correspond to usage on the plateform after 2015. The current usage metrics is available 48-96 hours after online publication and is updated daily on week days.
Initial download of the metrics may take a while.