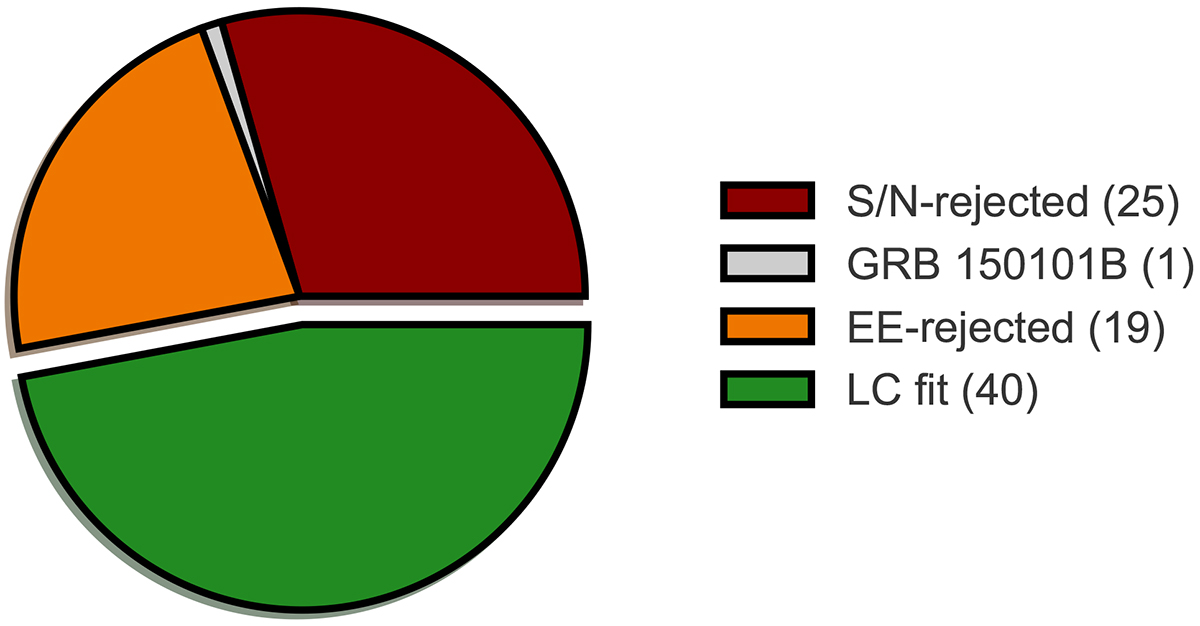
Fig. 2.
Download original image
Pie chart showing the results of our preliminary classification of the 85 SGRBs included in the initial sample. Three subsamples were excluded as they were not suitable for the light curve analysis: S/N-rejected (25, in brown), EE-rejected (19, in orange), and GRB 150101B (in grey). The remaining 40 cases, defined as the LC fit sample (in green), are those deemed suitable for further analysis.
Current usage metrics show cumulative count of Article Views (full-text article views including HTML views, PDF and ePub downloads, according to the available data) and Abstracts Views on Vision4Press platform.
Data correspond to usage on the plateform after 2015. The current usage metrics is available 48-96 hours after online publication and is updated daily on week days.
Initial download of the metrics may take a while.