Fig. 7
Download original image
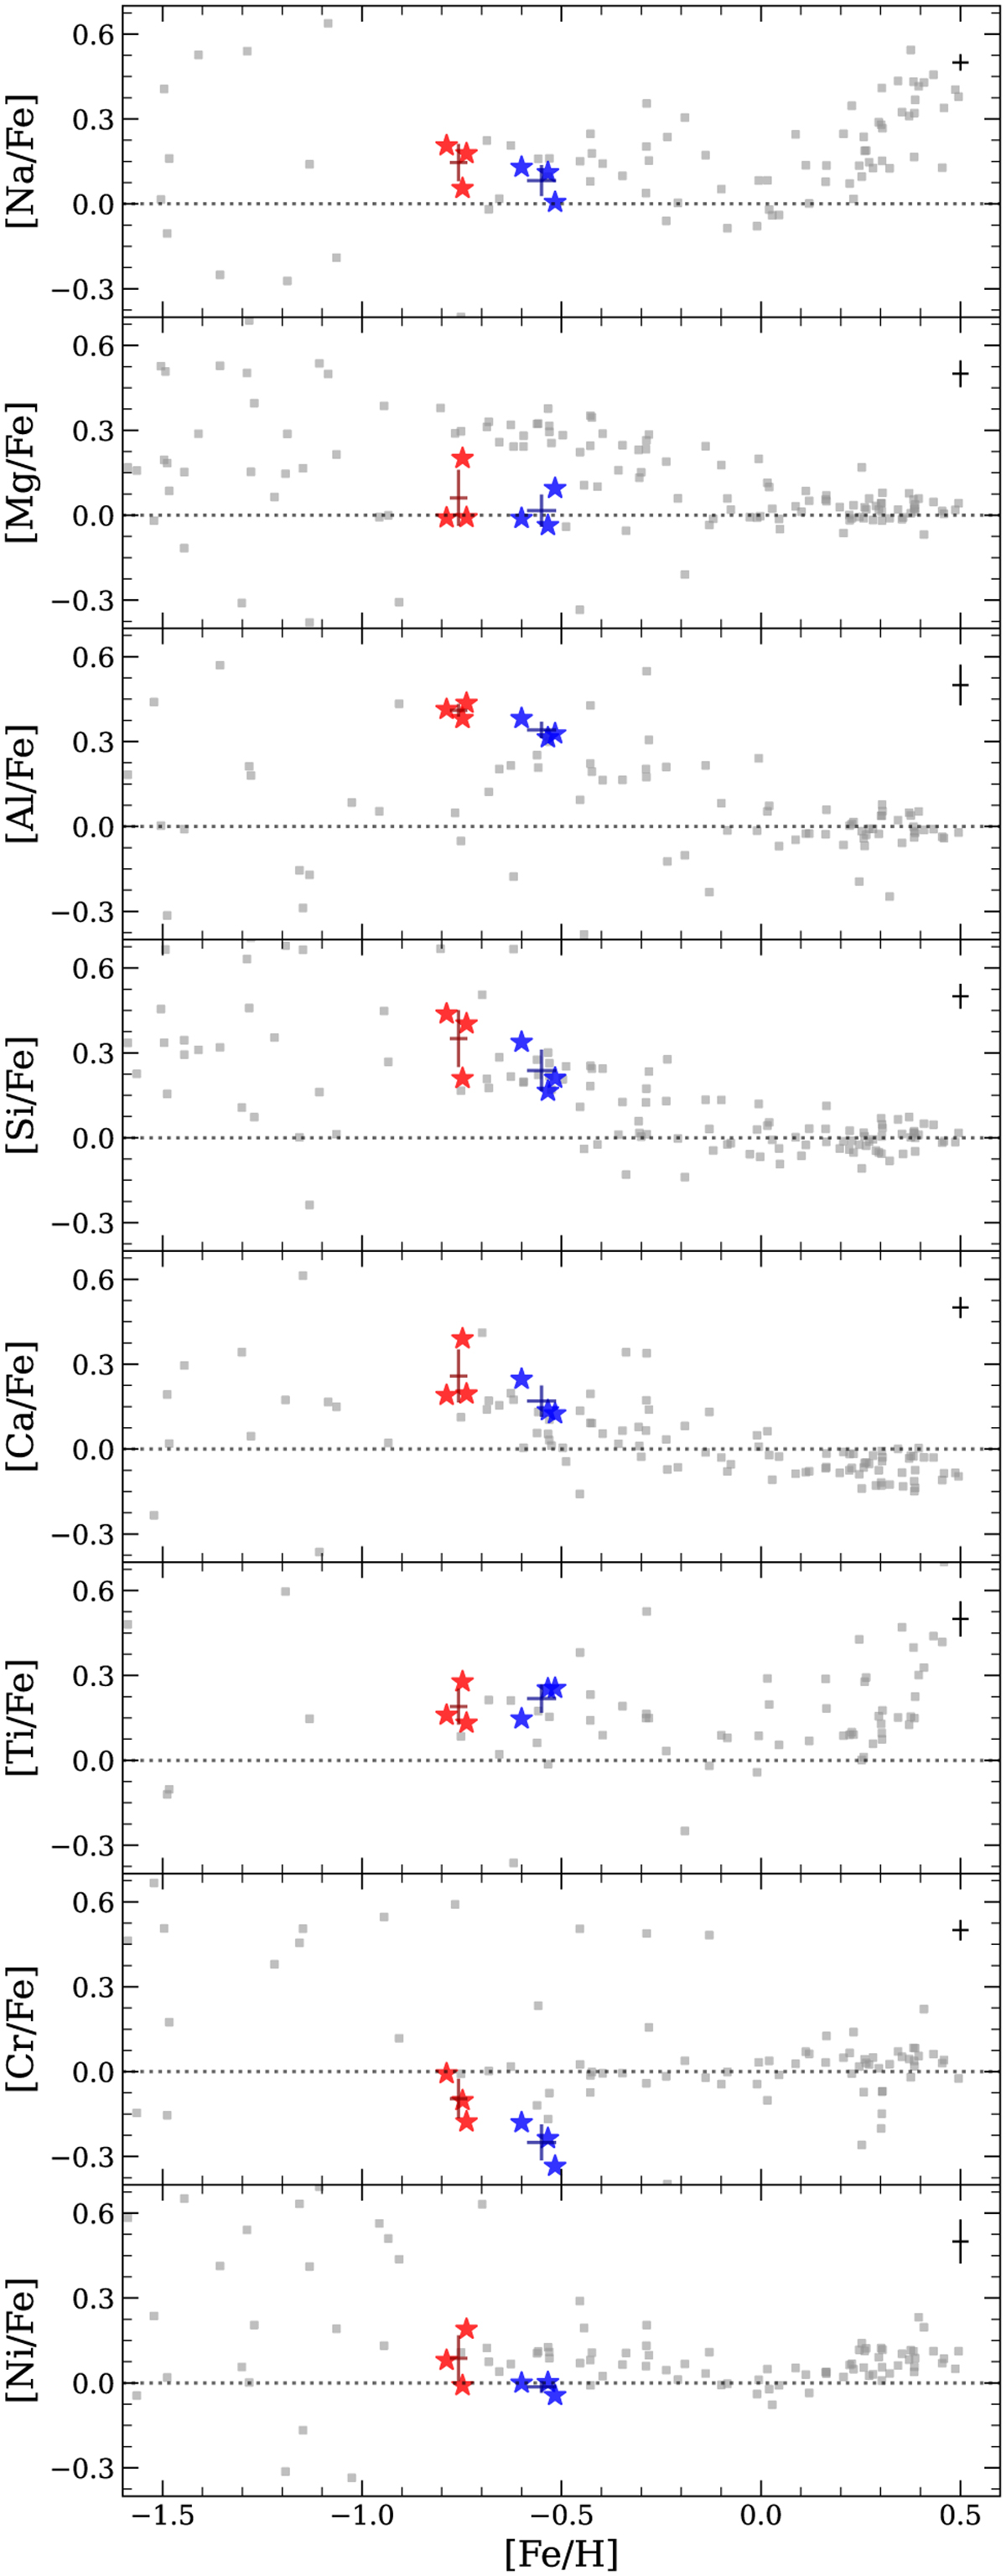
Chemical abundance ratios of the target stars, together with nearby APOGEE sample stars that are located within 30′ from the center of Gran 5 (gray squares). Metal-rich and metal-poor stars are represented by blue and red symbols, respectively, and the mean abundance ratios and standard deviations for each group are marked as blue and red crosses. The black cross in the upper right corner of each panel indicates the mean measurement error (±1σ) from the six sample stars, and the dotted horizontal lines represent the value of 0.0 dex for each abundance ratio.
Current usage metrics show cumulative count of Article Views (full-text article views including HTML views, PDF and ePub downloads, according to the available data) and Abstracts Views on Vision4Press platform.
Data correspond to usage on the plateform after 2015. The current usage metrics is available 48-96 hours after online publication and is updated daily on week days.
Initial download of the metrics may take a while.