Open Access
Fig. 4
Download original image
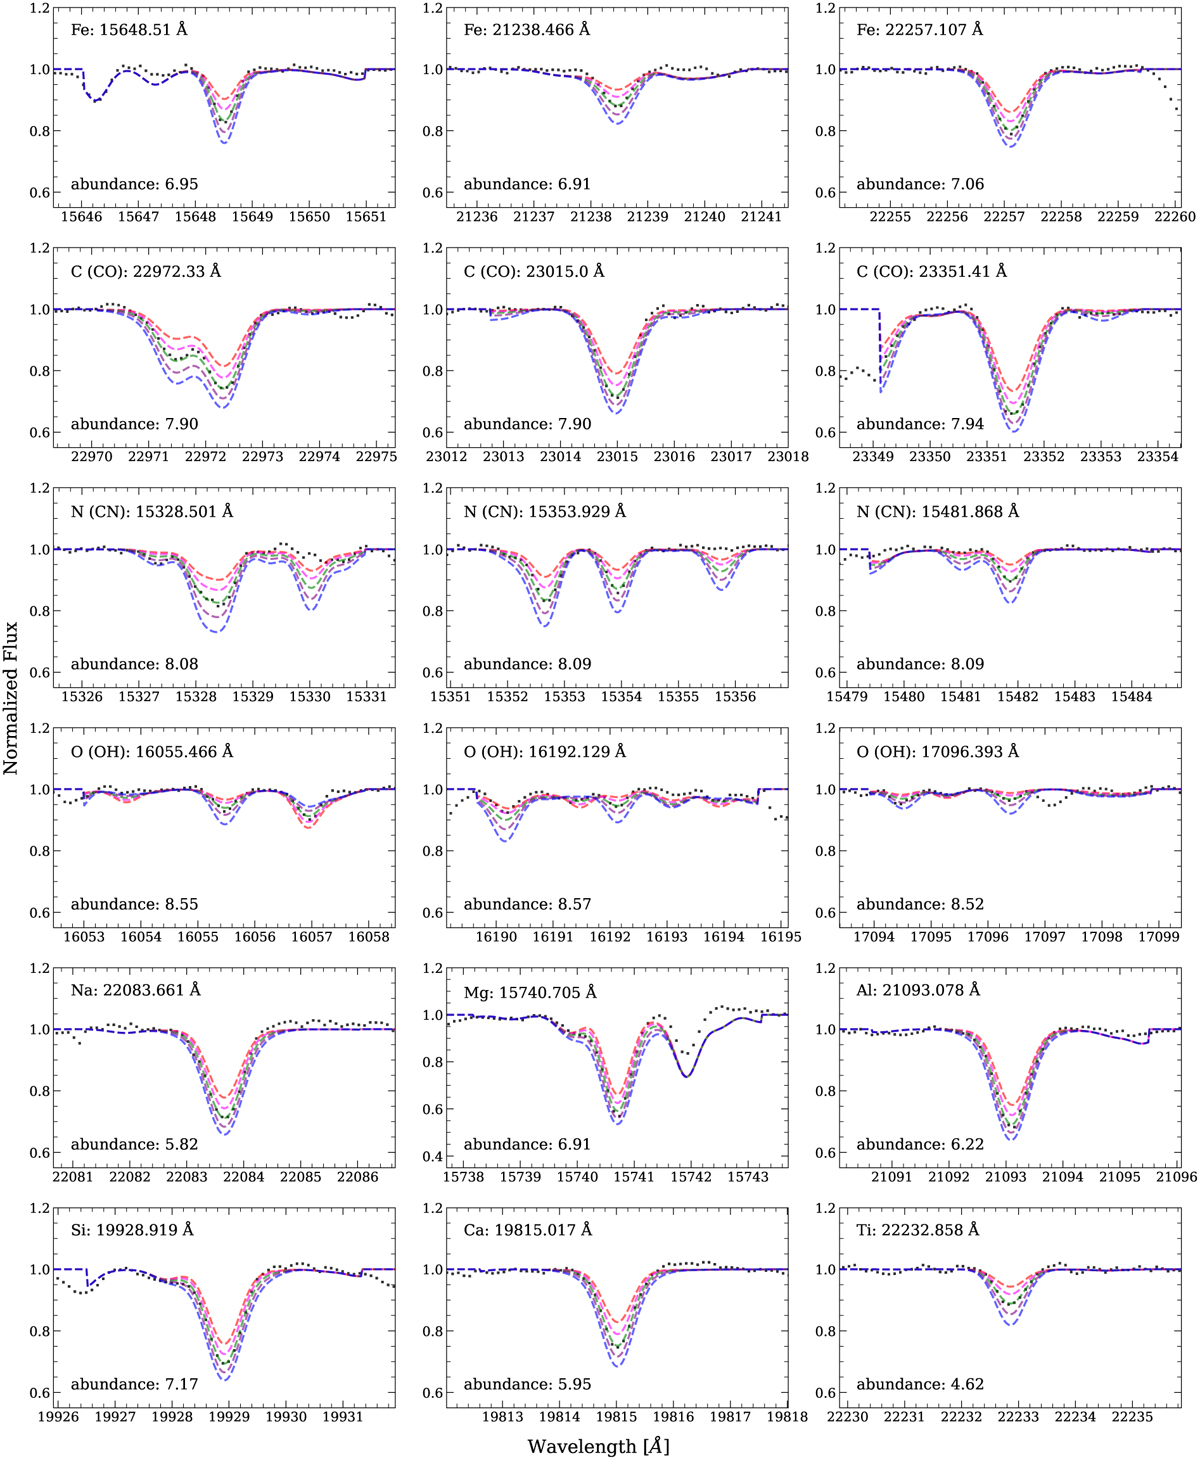
Observed spectrum of Gran 5-1 (black points) with synthetic spectra (dashed colored lines). The green line represents the best-fit model spectrum, and the other lines correspond to variations of −0.4, −0.2, +0.2, and +0.4 from this model.
Current usage metrics show cumulative count of Article Views (full-text article views including HTML views, PDF and ePub downloads, according to the available data) and Abstracts Views on Vision4Press platform.
Data correspond to usage on the plateform after 2015. The current usage metrics is available 48-96 hours after online publication and is updated daily on week days.
Initial download of the metrics may take a while.