Fig. 3.
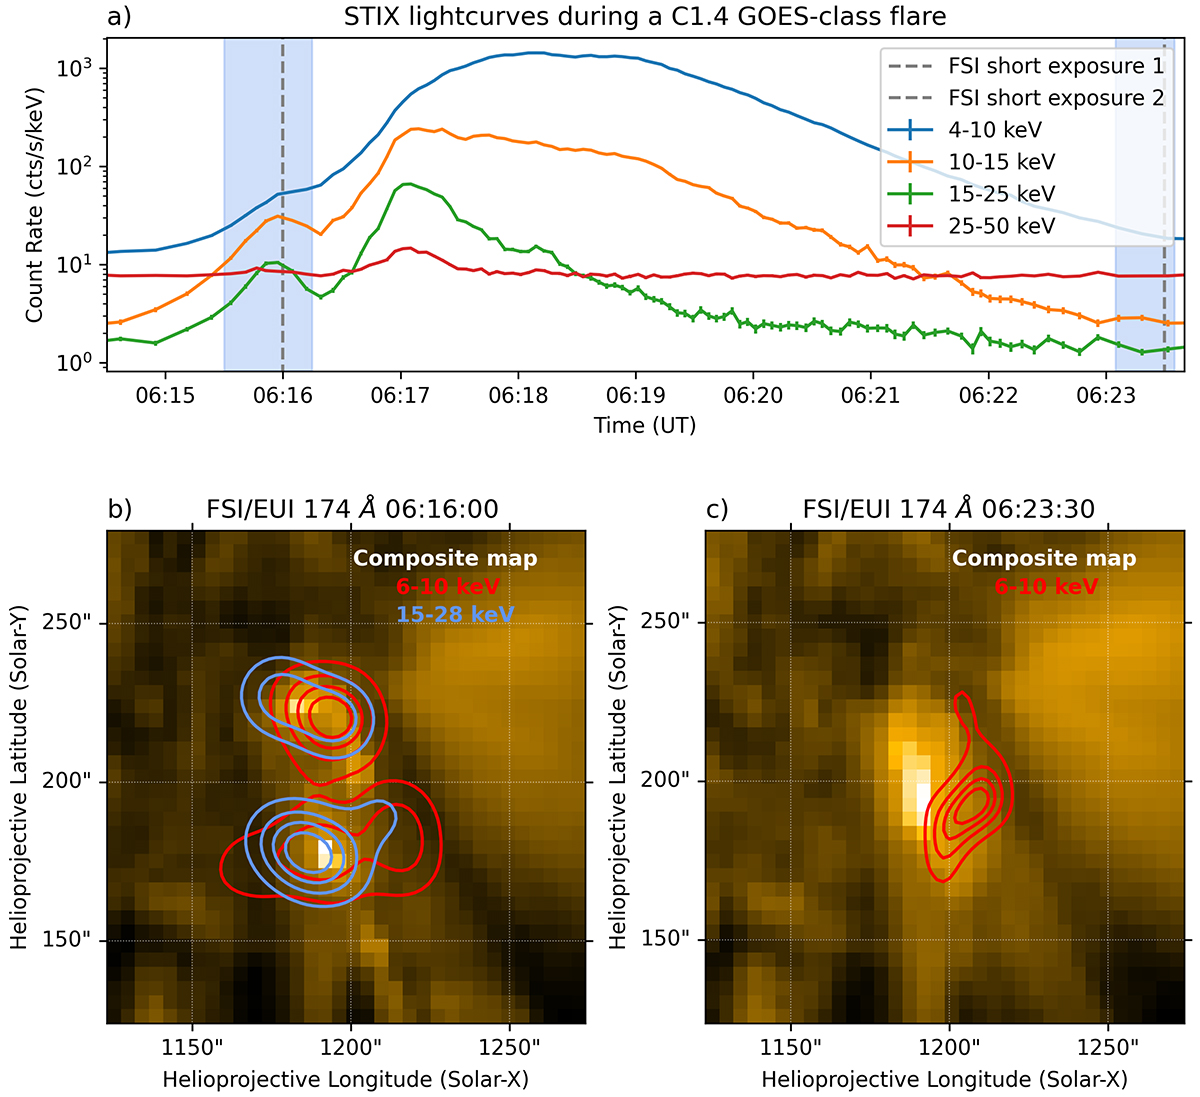
Download original image
Overview of STX2022-11-13T06:18. Panel a) shows the STIX light curves. The times of EUI/FSI short-exposure frames are denoted by dashed lines, and the time intervals used to create the STIX images shown in panels b) and c) are shaded in blue. Panels b) & c) show FSI/EUI 174 Å composite maps of the short- and normal-exposure exposure observations for the early and late frame, respectively. Panels b) and c) also show the STIX thermal (6–10 keV) and non-thermal (15–28 keV) emission overlaid on the EUI/FSI short-exposure frames for the two times, respectively. The 20, 40, 60, and 80% contour levels are shown. The maps shown have been rotated such that Solar north is pointing upwards.
Current usage metrics show cumulative count of Article Views (full-text article views including HTML views, PDF and ePub downloads, according to the available data) and Abstracts Views on Vision4Press platform.
Data correspond to usage on the plateform after 2015. The current usage metrics is available 48-96 hours after online publication and is updated daily on week days.
Initial download of the metrics may take a while.