Fig. 2.
Download original image
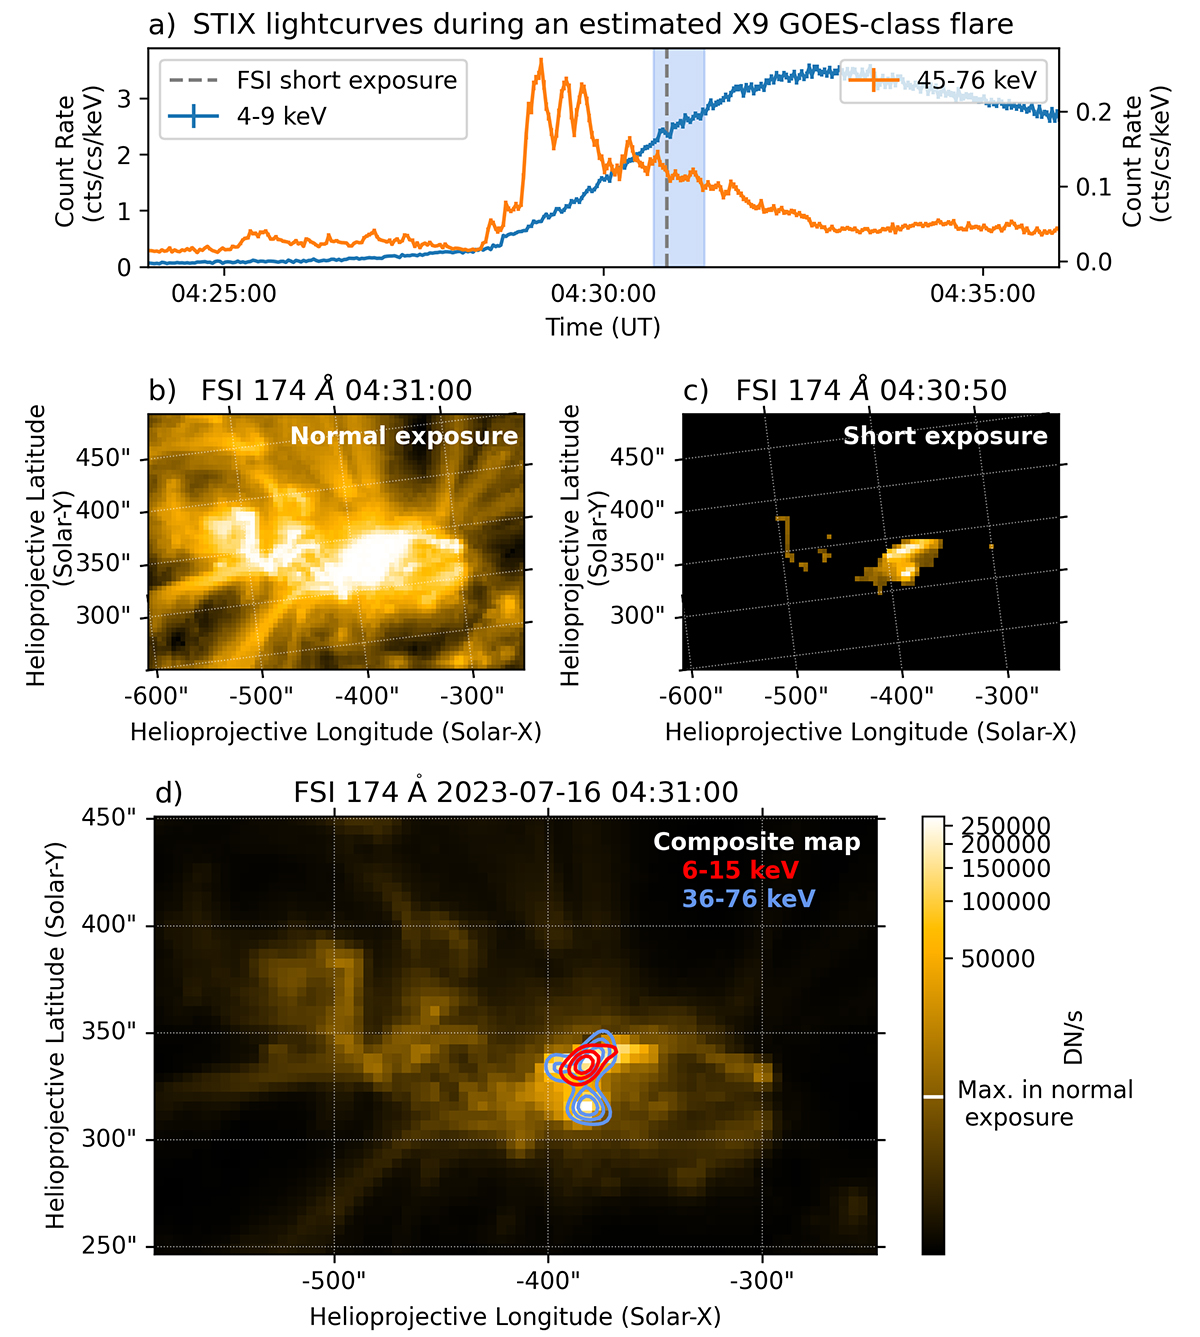
Overview of the STX2023-07-16T04:32 (estimated X9 GOES class) flare. Panel a) shows the STIX light curves. The non-thermal emission (45–76 keV) shows rapid variation on a timescale of ∼10 s. The thermal (4–9 keV) light curve is shown for the background detector only, as this detector is unaffected by attenuator motion (the attenuator was inserted during this flare). Panels b) and c) show the normal- and short-exposure observations of the flare site, respectively. Panel d) is a composite map with thermal (6–15 keV, in red) and non-thermal HXR contours (36–76 keV, in blue). The 40, 60, & 80% contour levels are shown. The fine structure revealed by the EUI/FSI short-exposure frame corresponds well to the HXR emission observed by STIX. This map has been rotated such that Solar north is pointing upwards, unlike panels b) and c). The maximum flux in the normal exposure frame is highlighted in the colour bar of panel d), highlighting the gain in dynamic range provided by the short-exposure observation.
Current usage metrics show cumulative count of Article Views (full-text article views including HTML views, PDF and ePub downloads, according to the available data) and Abstracts Views on Vision4Press platform.
Data correspond to usage on the plateform after 2015. The current usage metrics is available 48-96 hours after online publication and is updated daily on week days.
Initial download of the metrics may take a while.