Fig. 4
Download original image
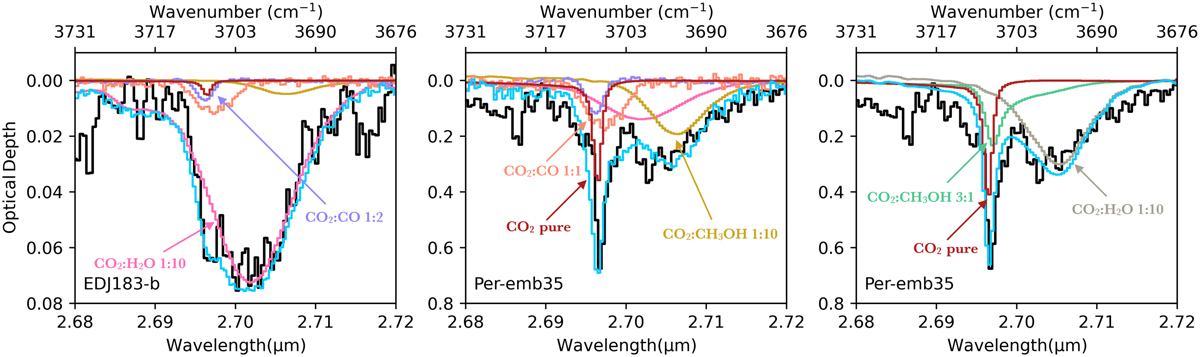
Profile decomposition of the 12CO2 2.70 µm combination mode using selected laboratory spectra based on the analysis performed in Brunken et al. (2024). In the left and middle panel, the black line shows the observed spectrum, and the blue line shows the linear combination of all the five different components at low temperature. The yellow line corresponds to the CO2:CH3OH (10 K) component. The pink line shows the contribution of the broad CO2:H2O (10 K) component. The purple line corresponds to the diluted CO2:CO (25 K) component, and the orange line shows the contribution of CO2 and CO mixed in an equal ratio (15 K). Finally, the dark red line corresponds to the pure CO2 (80 K) component. In the right panel, the black line shows the observed spectrum, and the blue line shows the linear combination of all the three different components at high temperatures. The green line corresponds to the hot CO2:CH3OH (105 K) component. The gray line shows the contribution of the hot CO2:H2O (160 K) component. Finally, the dark red line corresponds to the pure CO2 (80 K) component. All laboratory spectra are taken from Ehrenfreund et al. (1997, 1999); van Broekhuizen et al. (2006) and are publicly available in the Leiden Ice Database (LIDA) (Rocha et al. 2022). Further details of the laboratory spectra can be found in Brunken et al. (2024).
Current usage metrics show cumulative count of Article Views (full-text article views including HTML views, PDF and ePub downloads, according to the available data) and Abstracts Views on Vision4Press platform.
Data correspond to usage on the plateform after 2015. The current usage metrics is available 48-96 hours after online publication and is updated daily on week days.
Initial download of the metrics may take a while.