Fig. 2
Download original image
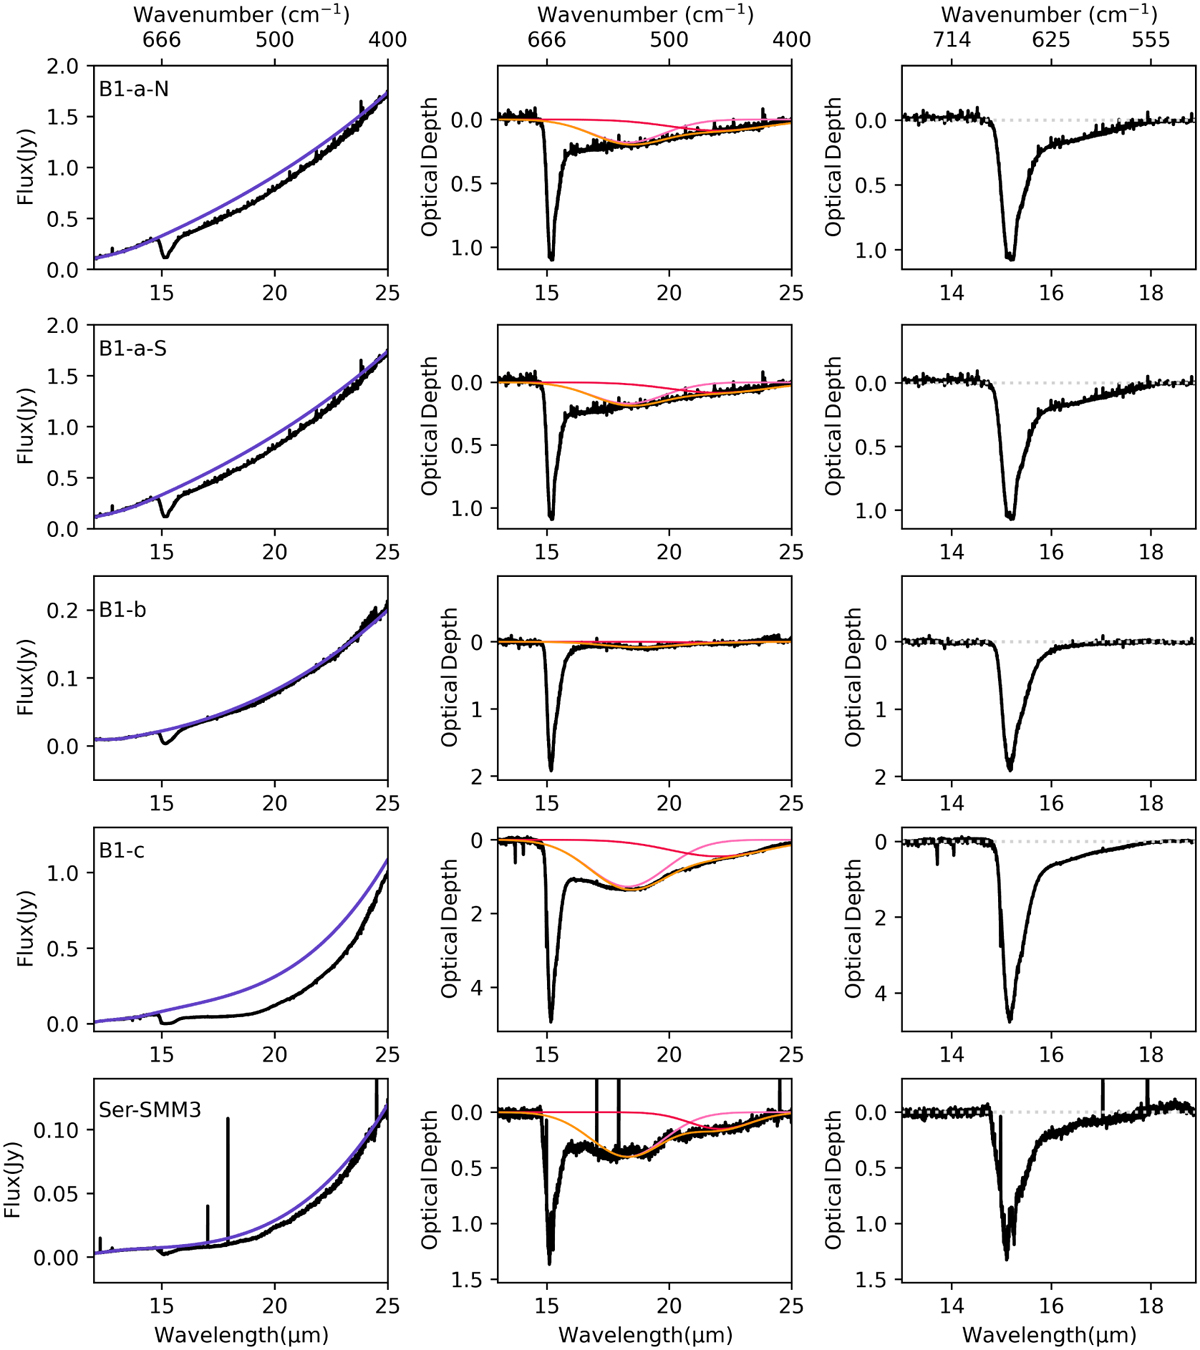
Continuum and silicate subtraction for the 12CO2 bending mode in the 15 µm region. The left panel shows the fitting of the continuum (purple line). The middle panel shows the two Gaussian profiles (red and pink lines) and the combined final fit (orange line), which simulates the silicate absorption feature at 18 µm. The third panel shows the subtracted spectra after the silicate band was removed. The continuum subtraction for the remaining sources can be found in Appendix B.2.2.
Current usage metrics show cumulative count of Article Views (full-text article views including HTML views, PDF and ePub downloads, according to the available data) and Abstracts Views on Vision4Press platform.
Data correspond to usage on the plateform after 2015. The current usage metrics is available 48-96 hours after online publication and is updated daily on week days.
Initial download of the metrics may take a while.