Fig. 11
Download original image
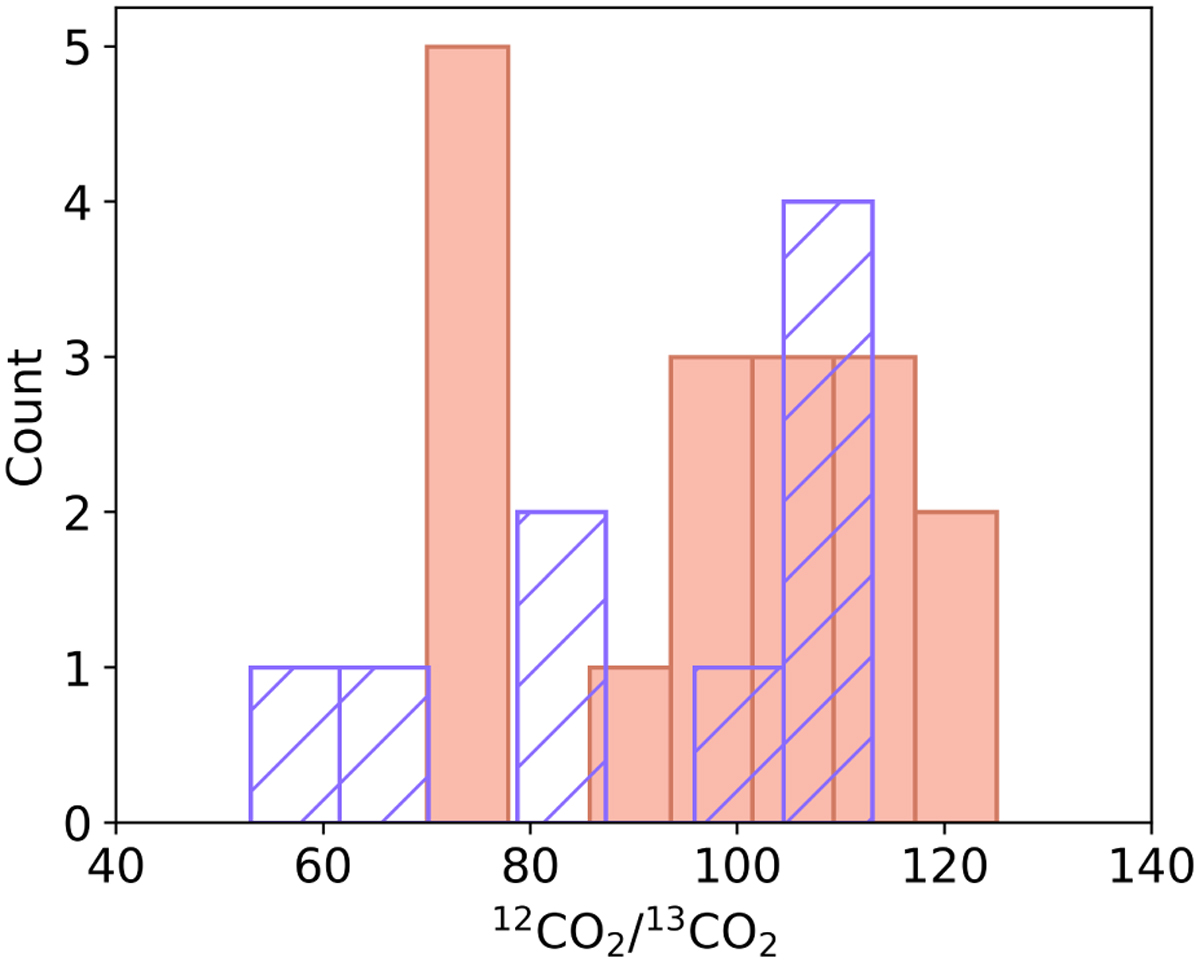
Distribution of the 12CO2/13CO2 isotope ratio. The filled orange bars show the distribution of the carbon isotope ratios determined for the JOYS+ sample. These ratios were extracted from the 15.2 µm bending mode. The striped purple bars show the distribution of the carbon isotope ratio derived for the ISO high-mass sources (Boogert et al. 2000).
Current usage metrics show cumulative count of Article Views (full-text article views including HTML views, PDF and ePub downloads, according to the available data) and Abstracts Views on Vision4Press platform.
Data correspond to usage on the plateform after 2015. The current usage metrics is available 48-96 hours after online publication and is updated daily on week days.
Initial download of the metrics may take a while.