Fig. 10
Download original image
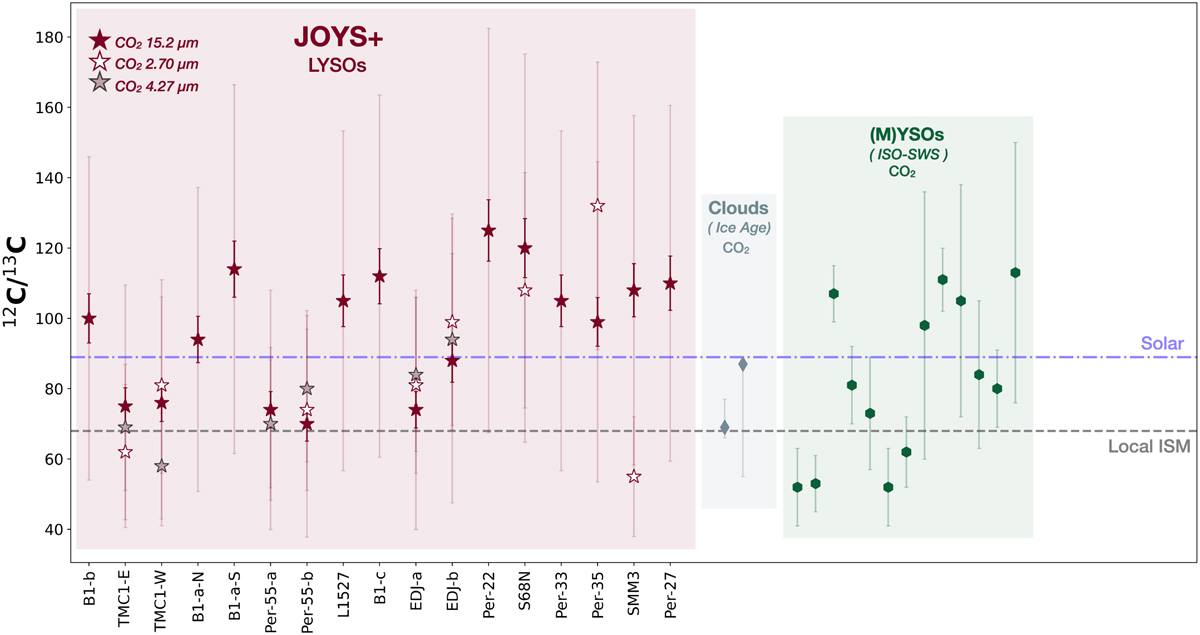
Solid 12C/13C for various astronomical environments. The filled red, gray, and white stars represent the ratios derived from the 12CO2 15.2, 4.27, and 2.70 µm bands, respectively. We also include molecular clouds (Ice Age) (McClure et al. 2023) and a massive YSO (Infrared Space Observatory). (Boogert et al. 2000). The dashed purple line shows the solar abundance, and the dot-dashed gray line shows the local ISM ratio (Boogert et al. 2000). The small solid error bars of the JOYS+ data points illustrate when the band strengths were excluded from the error analysis. The faint and generally larger error bars of the JOYS+ data points illustrate the uncertainty, including the error on the band strength. Further details of the error analysis can be found in Appendix A.
Current usage metrics show cumulative count of Article Views (full-text article views including HTML views, PDF and ePub downloads, according to the available data) and Abstracts Views on Vision4Press platform.
Data correspond to usage on the plateform after 2015. The current usage metrics is available 48-96 hours after online publication and is updated daily on week days.
Initial download of the metrics may take a while.